In this article, we examine the research on the pervasiveness of corporate fraud (misconduct or alleged fraud), which is one of the (less emphasized) costs of public ownership.
How Pervasive is Corporate Fraud
- Alexander Dyck, Adair Morse, Luigi Zingales
- Review of Accounting Studies, 2022
- A version of this paper can be found here
- Want to read our summaries of academic finance papers? Check out our Academic Research Insight category
What are the Research Questions?
To enrich themselves, managers who own a relatively small fraction of the stock might be willing to break the law, even when the cost of breaking the law from the company’s point of view exceeds its benefits.
- How pervasive is corporate fraud?
- Is it possible to estimate the losses produced by fraud?
What are the Academic Insights?
The quick answer is that fraud is like an iceberg with significant undetected fraud beneath the surface.
By using the natural experiment provided by the sudden demise of a major auditing firm, Arthur Andersen, to infer the fraction of corporate fraud that goes undetected and by calculating an estimate of the ratio of the exposed tip to the submerged portion, also known as the detection likelihood, the authors find:
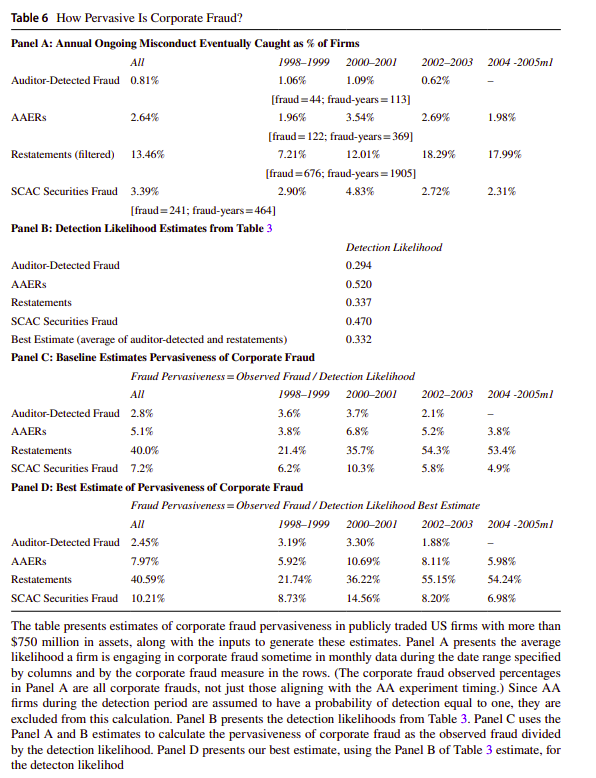
- Accounting violations are widespread: in an average year, 41% of companies misrepresent their financial reports (i.e., two out of three corporate frauds go undetected), even when we ignore simple clerical errors. Fortunately, securities fraud is less pervasive. In an average year, 10% of all large public corporations commit (alleged) securities fraud, with a 95% confidence interval between 7 and 14%.
- For detected frauds, they use the decline in equity value at the revelation of the fraud, as estimated by Karpof et al. (2008) (henceforth “KLM”). For undetected frauds, they apply the average value lost due to cover-up, as estimated by Beneish et al. (2013). Combining these detected and undetected fraud losses – 25% and 11% of the equity value, respectively – to the proportion of frauds detected (0.33) and undetected (0.67) results in an average fraud cost of 16% of equity value. Putting together our estimate of the pervasiveness of fraud (10%) with the per-firm cost of fraud (16%), the authors arrive at an expected annual cost of fraud of 1.6% of the total equity value of US public firms (with a 95% interval between 1.2% and 2.2%). Hence, the annual cost of fraud among US corporations at the end of our sample period (2004) is $254 billion, bringing the cost calculation forward to 2021 – $830 billion. By comparing the 2004 expected cost of fraud with the $19.9 billion of annual SOX compliance cost (as estimated by Hochberg et al. (2009)), for the benefits of SOX to exceed its costs, SOX would have to reduce the probability of fraud initiation by one percentage point (equal to 10% of the baseline probability).
The authors perform many robustness checks to validate their analysis.
Why does this matter?
This study is essential to the literature because it shows a dismal picture of the effectiveness of financial auditing pre-SOX. Even though this paper cannot answer whether SOX reduced or eliminated the problem, the magnitude of the problem suggests that some action was warranted. Based on the authors’ estimates, it is possible to infer that if the new regulation reduced by 10% the probability of starting a fraud, its cost would be fully justified.
The Most Important Chart from the Paper:
The results are hypothetical results and are NOT an indicator of future results and do NOT represent returns that any investor actually attained. Indexes are unmanaged and do not reflect management or trading fees, and one cannot invest directly in an index.
Abstract
We provide a lower-bound estimate of the undetected share of corporate fraud. To identify the hidden part of the “iceberg,” we exploit Arthur Andersen’s demise, which triggered added scrutiny on Arthur Andersen’s former clients and thereby increased the detection likelihood of preexisting frauds. Our evidence suggests that in normal times only one-third of corporate frauds are detected. We estimate that
on average 10% of large publicly traded frms are committing securities fraud every year, with a 95% confidence interval of 7%-14%. Combining fraud pervasiveness with existing estimates of the costs of detected and undetected fraud, we estimate that corporate fraud destroys 1.6% of equity value each year, equal to $830 billion in 2021.

About the Author: Elisabetta Basilico, PhD, CFA
—
Important Disclosures
For informational and educational purposes only and should not be construed as specific investment, accounting, legal, or tax advice. Certain information is deemed to be reliable, but its accuracy and completeness cannot be guaranteed. Third party information may become outdated or otherwise superseded without notice. Neither the Securities and Exchange Commission (SEC) nor any other federal or state agency has approved, determined the accuracy, or confirmed the adequacy of this article.
The views and opinions expressed herein are those of the author and do not necessarily reflect the views of Alpha Architect, its affiliates or its employees. Our full disclosures are available here. Definitions of common statistics used in our analysis are available here (towards the bottom).
Join thousands of other readers and subscribe to our blog.