As Cliff Asness demonstrated in his 2012 paper “An Old Friend: The Stock Market’s Shiller P/E,” valuations provide quite a bit of important information for investors. What do valuation spreads tell us about future expected returns? Higher starting values mean that not only are future expected returns lower, but the best outcomes are lower and the worst outcomes are worse. The reverse is true as well—lower starting values mean that not only are future expected returns higher, but the best outcomes are higher and the worst outcomes are less poor. However, it’s also important to understand that a wide dispersion of potential outcomes, for which we must prepare when developing an investment plan, still exists—high (low) starting valuations don’t necessarily result in poor (good) outcomes. In other words, investors should not think of a forecast as a single-point estimate, but only as the mean of a wide potential dispersion of returns. The main reason for the wide dispersion is that the empirical research, such as the 2017 study “Fama-French Factors and Business Cycles,” has found that risk premiums are time-varying (if they were not, there would be no risk in investing!). It is the time-varying risk premium that leads to the wide dispersion in outcomes.
Given that valuations provide information on equity returns, it should not be surprising that valuation spreads provide information on future factor premiums. For example, the authors of the November 2019 study “Value Return Predictability Across Asset Classes and Commonalities in Risk Premia,” found: “Returns to value strategies in individual equities, industries, commodities, currencies, global government bonds, and global stock indexes are predictable in the time series by their respective value spreads.” Further evidence on valuation spreads was provided by Thiago de Oliveira Souza, author of the 2018 study “Macro-Finance and Factor Timing: Time-Varying Factor Risk and Price of Risk Premiums.” He found that increases in the cross-sectional book-to-market spreads significantly forecast increases in one-month-ahead premiums for all except the profitability factor. Souza’s findings were consistent with those of Adam Zaremba and Mehmet Umutlu, authors of the 2019 study “Strategies Can Be Expensive Too! The Value Spread and Asset Allocation in Global Equity Markets,” who found that the value spread is a powerful and robust predictor of strategy returns.
Current Valuation Spreads
With the understanding that the spread in valuations between the long and the short side of factors contains information as to future factor premiums, Robert Arnott and Amie Ko of Research Affliliates examined the valuation spreads of five of the most commonly used factors over the period of June 30, 1968, to September 2022:
- Quality (based on gross profitability, defined as revenues minus cost of goods sold divided by assets).
- Low beta.
- Momentum.
- Size (small versus large market-cap).
- Value (based on the ratio of price-to-book value).
They calculated each factor in four segments of the global equity markets: the U.S., with large and small taken separately, developed markets (including the U.S.) and emerging markets.
For each of these factors, in each of these global market segments, they calculated the historical range of relative valuation for each factor based on an average of four relative valuation measures: relative price-to-sales, relative price-to-cash flow, relative price-to-book, and relative price-to-dividends. In each case, and at each point in time, the blended average relative-valuation multiple was calculated for the long portfolio as a ratio relative to the short portfolio. They noted that some factors always trade cheap (for example, value, where value stocks always trade at a discount to growth stocks by definition), while others tend to trade rich (such as quality and momentum). They added that the “key point is whether a factor is trading richer or cheaper than its own historical norms.”
In the chart below, the top and bottom of the bars indicate the 10th and 90th percentiles, respectively, of the historical relative valuation for each factor.
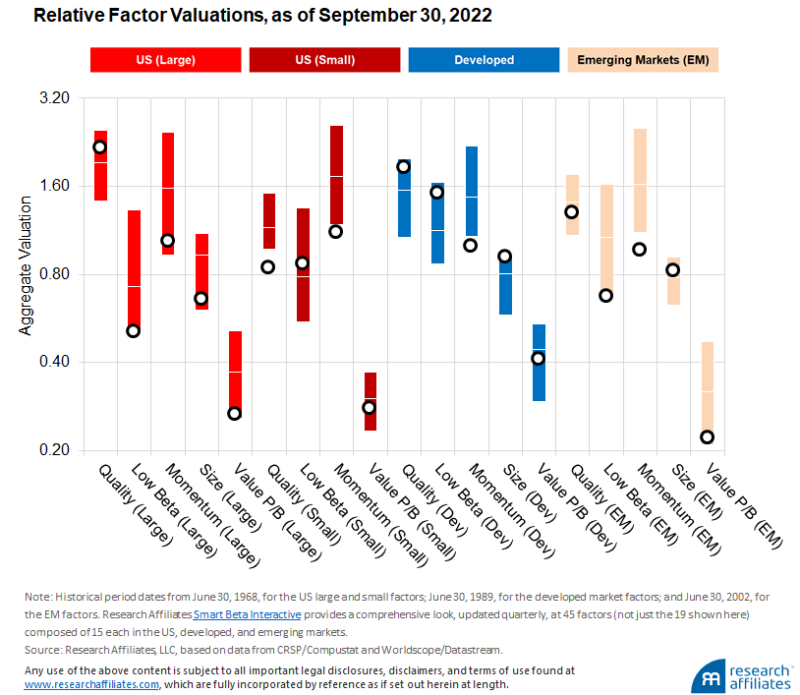
Arnott and Ko observed that at the end of September 2022, of the 19 factors, 14 were trading cheap and 11 were in their historically cheapest quintile ever. Of the five richest factors, one (quality in the developed markets) was in the top quintile of historical relative valuation, “likely a direct consequence of the geopolitical shocks in Europe and Japan.” Their findings led them to conclude: “Now appears to be a particularly promising time to embrace multi-factor investing.”
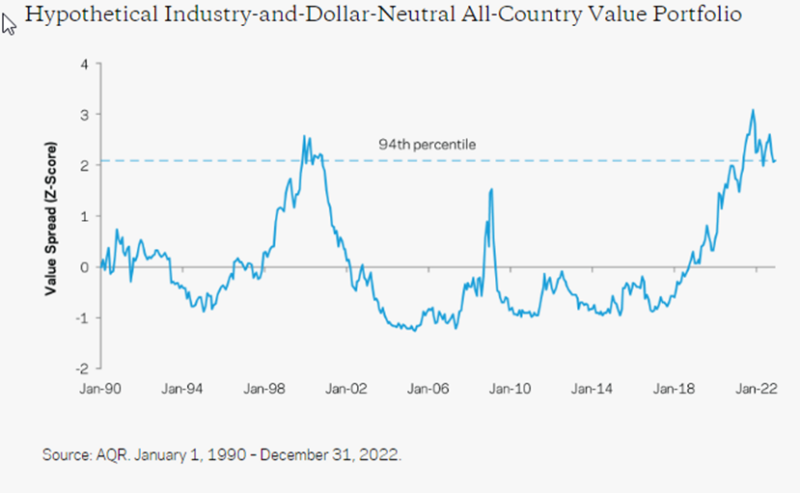
Value investors, in particular, should be optimistic, as value was trading at historically cheap levels all around the globe, especially in the emerging markets. The following chart from AQR shows that a hypothetical industry- and dollar-neutral all-country value portfolio was at the 94th percentile of cheapness at the end of 2022.
Investor Takeaways
For value investors, the above findings are good news. The largest historical drawdown for the value premium from November 2016 through October 2020 led to a dramatic widening of the book-to-market spread between value and growth stocks. Even with the strong performance of the value premium since then, the spread is still much wider than its historical average and much wider than it was when Eugene Fama and Kenneth French published their famous study “The Cross-Section of Expected Stock Returns” in 1992. Thus, the expectation is that the value premium will be larger than its historical average.
Larry Swedroe is head of financial and economic research for Buckingham Wealth Partners.
For informational and educational purposes only should only be construed as specific investment, accounting, legal, or tax advice. Certain information is based on third party data which may become outdated or otherwise superseded without notice. Third party information is deemed to be reliable, but its accuracy and completeness cannot be guaranteed. Indices are not available for direct investment. Their performance does not reflect the expenses associated with the management of an actual portfolio nor do indices represent results of actual trading. Information from sources deemed reliable, but its accuracy cannot be guaranteed. Performance is historical and does not guarantee future results. All investments involve risk, including loss of principal. By clicking on any of the links above, you acknowledge that they are solely for your convenience, and do not necessarily imply any affiliations, sponsorships, endorsements or representations whatsoever by us regarding third-party websites. We are not responsible for the content, availability or privacy policies of these sites, and shall not be responsible or liable for any information, opinions, advice, products or services available on or through them. Neither the Securities and Exchange Commission (SEC) nor any other federal or state agency have approved, determined the accuracy, or confirmed adequacy of this article. The opinions expressed here are their own and may not accurately reflect those of Buckingham Strategic Wealth®, or its affiliates. LSR-23-444
About the Author: Larry Swedroe
—
Important Disclosures
For informational and educational purposes only and should not be construed as specific investment, accounting, legal, or tax advice. Certain information is deemed to be reliable, but its accuracy and completeness cannot be guaranteed. Third party information may become outdated or otherwise superseded without notice. Neither the Securities and Exchange Commission (SEC) nor any other federal or state agency has approved, determined the accuracy, or confirmed the adequacy of this article.
The views and opinions expressed herein are those of the author and do not necessarily reflect the views of Alpha Architect, its affiliates or its employees. Our full disclosures are available here. Definitions of common statistics used in our analysis are available here (towards the bottom).
Join thousands of other readers and subscribe to our blog.