Investment strategy should be based on three fundamental principles. First, markets are highly, though not perfectly, efficient. That leads to the conclusion that active management is the loser’s game. Second, if markets are efficient, it must follow that you should believe that all unique sources of risk have similar risk-adjusted returns. Third, if all individual sources of risk have similar risk-adjusted returns, the logical conclusion is that portfolios should be diversified across as many unique/independent sources of risk and return as you can identify that meet the criteria of persistence, pervasiveness, robustness to various definitions, implementability (survives transactions costs) and have intuitive risk- or behavioral-based explanations that provide reasons for believing the premium should persist in the future.
The problem is that traditional portfolios are dominated by a single risk, or factor: the market factor. As the following example (using “risk points”) demonstrates, a traditional 60/40 portfolio, one that invests in total market funds, has much more than 60% of its risk in the market factor. That’s because stocks are much riskier (more volatile) than bonds.
Hypothetical Portfolio: 60% Stocks/40% Bonds
- Equity volatility: 20%
- Bond volatility (5-year average maturity): 5%
- Equity Risk: 60 x 20 = 1200 risk points
- Bond Risk: 40 x 5 = 200 risk points
- Total Risk: 1200 + 200 = 1400 risk points
- Percentage Equity Risk: 1200/1400 = 86%
Given the premise of market efficiency, which leads to the belief that all unique risks (or factors) should have similar risk-adjusted returns, many investors have sought to diversify their portfolios to reduce the dominance of the market risk factor. That has led to heightened interest by investors seeking to harvest other premiums by investing in factor-based mutual funds and exchange-traded funds (ETFs). Today, there are trillions of dollars invested in such vehicles. The equity factors that have attracted the most attention from academic research are size, value, momentum, and quality. The essential question for those adopting factor-based strategies is how to build portfolios that allocate across those factors.
To address the question, Kevin Khang, Antonio Picca, Shaojun Zhang, and Minzhi Zhu, authors of the September 2021 study “How Inefficient is the 1/N Strategy for a Factor Investor?,” examined the performance of three classic allocation strategies: 1/N (naively equal weighting across the number of factors considered); mean-variance (an allocation that jointly maximizes the expected return and minimizes the expected volatility of the portfolio); and minimum-variance (an allocation that minimizes the portfolio risk measured by volatility) to determine whether the naive 1/N approach was an efficient one. (More on 1/N strategies here.)
The factors they considered were value, momentum, and quality. However, they also split each factor into large and small stocks. Notably, they accounted for estimated transaction costs. And because most individual investors and their financial advisors, as well as many institutional investors, cannot short sell assets, they also limited the analysis to long-only strategies. In addition, they considered imposing reasonable diversification constraints (for example, no factor could account for more than 90% or less than 10%).
They examined the implementation of one-factor, two-factor, and three-factor portfolios across three different parameter estimations (first 20 years, rolling ten years, and rolling 20 years) and various constraints on minimum and maximum allocations. That led to 471 distinct asset allocation strategies, which they analyzed using a bootstrapping methodology (random sampling with replacement). Their study covered the period July 1963-June 2020.
Following is a summary of their key findings:
- Comparing the averages of large-cap portfolios, a mean active return of 1.5% was the maximum attainable. And the 1/N portfolio with all three-factor funds (along with three-factor MV, or mean variance, and two-factor GMV, or minimum variance, portfolios, both with [0%, 100%] constraint) was one of the few funds achieving this level of return.
- The difference was a bit starker in the small-cap space, with 1/N continuing to achieve the highest return over the market (3.2%) and sharing the top performance only with the two-factor GMV portfolio with [0%, 100%] constraint.
- The strong return performance of the 1/N strategy also came with less variability around the outcome realizations. This was especially true for the large-cap portfolio, where the 0.6% standard deviation for 1/N was among the lowest of the strategies examined.
The table below shows the summary statistics of average annualized returns:
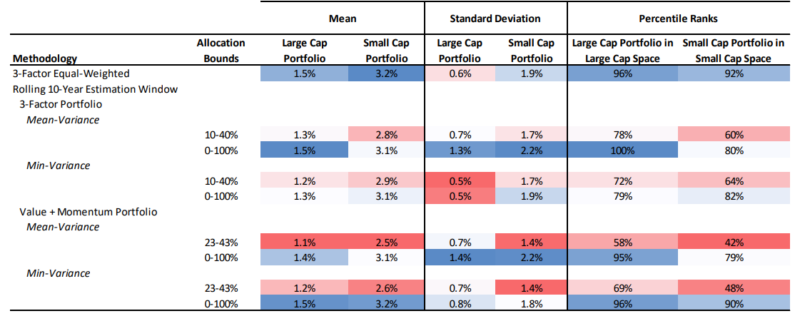
Regarding percentile ranking (see the two right-hand columns in the table), in both cap universes, the 1/N portfolio with three-factor funds are near the very top.
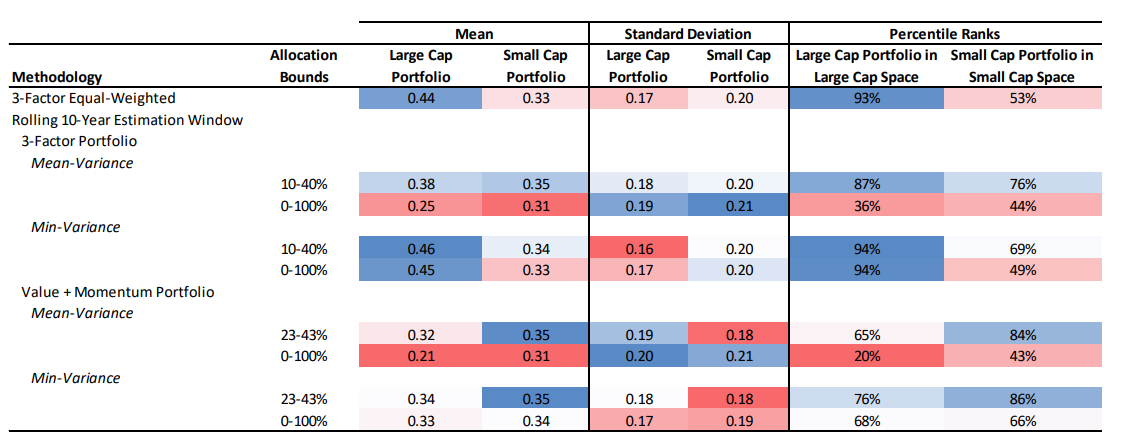
The authors also examined the various allocation strategies’ information ratios (a measurement of portfolio returns beyond the returns of a benchmark, usually an index, compared to the volatility of those returns). The table below shows the summary statistics of the information ratios. Once again, 1/N scores very well. They noted that in the small-cap universe, the percentile rankings are not as meaningful because of the tight dispersion: “For example, in the small-cap universe, 1/N and the two GMV allocations have at most 0.04 difference in information ratio: 0.31 for GMV with [0%, 100%], 0.33 for 1/N, and 0.35 with [10%, 40%]. These, however, translate into 44%, 53%, and 76% in percentile rankings, reflecting the density of allocation strategies with information ratios around mid-0.3’s.”
Their findings led Khang, Picca, Zhang, and Zhu to conclude: “1/N is a very effective allocation strategy and compares favorably with other optimization-based approaches. Notably, 1/N demonstrates effectiveness on both key dimensions factor investors tend to prioritize—the active return and information ratio. No alternative strategy consistently dominates the seemingly naïve 1/N strategy in both performance metrics and cap spaces.”
Khang, Picca, Zhang, and Zhu’s findings are consistent with those of Christoph Reschenhofer, author of the 2022 paper “Combining Factors,” in which he investigated the performance of multifactor portfolios formed via a combination of stock characteristics scores. His findings led him to conclude: “Especially out-of-sample, portfolios based on equal weights on each characteristic are very difficult to beat.” They are also consistent with the findings of Victor DeMiguel, Lorenzo Garlappi, and Raman Uppal, authors of the 2009 study “Optimal Versus Naive Diversification: How Inefficient is the 1/N Portfolio Strategy?,” who examined 14 different portfolio construction strategies (including mean variance and minimum variance) and found that naive 1/N portfolios tend to be about as efficient as any other strategy.
Before summarizing, let’s look at how investors can easily implement a 1/N-like portfolio.
Implementation
We begin by considering a traditional 60/40 portfolio using Vanguard’s Total Stock Market Fund (VTSMX) and their Intermediate-Term Treasury Fund (VFITX). We then consider using either Vanguard’s Small Value Index Fund (VISVX) Dimensional’s U.S. Small Value Fund (DFSVX) instead of VTSMX for our equity exposure, as they have exposures to not only the market factor but also the size, value, momentum and quality factors we have been discussing. The starting point for our analysis is 2013 because that is when Dimensional began to incorporate the profitability factor (which is highly correlated to the quality factor) into its fund construction rules (it began to screen out stocks with negative momentum in 2003). Factor data was available through November 2022.
| VFITX | VTSMX | DFSVX | Portfolio A 60% VFIAX /40% VFITX | Portfolio B 40% DFSVX /60% VFITX | |
| Market | 1.01 | 1.09 | 0.60 | 0.44 | |
| Size | -0.01 | 1.03 | 0.00 | 0.41 | |
| Value | -0.02 | 0.58 | 0.00 | 0.23 | |
| Momentum | 0.01 | 0.04 | 0.00 | 0.02 | |
| Quality | 0.06 | 0.45 | 0.04 | 0.18 | |
| Term | 0.29 | 0.12 | 0.18 |
Using the regression tool at Portfolio Visualizer, we find that Portfolio A has most of the risk concentrated in the market factor. On the other hand, because DFSVX has exposure to other factors with expected premiums in Portfolio B, we can lower our exposure to the market factor while gaining exposure to the size, value, and quality factors and increasing our exposure to the term factor. The result is that portfolio B is more diversified across factors—one that is much closer to the 1/N concept and to the strategy known as risk parity (a portfolio allocation strategy that uses risk to determine allocations across various components of an investment portfolio). Note that if an investor wanted more exposure to the momentum factor (both cross-sectional and time-series [trend]), funds can provide that exposure. Funds such as AQR’s QSPRX and QRPRX are long-short funds that provide exposure to several factors (value, momentum, carry, and defensive) across multiple asset classes.
Investors are not limited to public equities in their search for other unique sources of risk and return. For example, investors with access to interval funds can consider adding exposure to reinsurance risks (funds such as SRRIX, SHRIX, and XILSX), private credit (funds such as CCLFX, CELFX, and LENDX), and the aforementioned long-short factor funds of AQR (QSPRX and QRPRX).
Investor Takeaways
Factor investing has become an integral part of investment strategies for a wide range of investors, from sophisticated institutional allocators to financial advisors and individual investors, allowing them to access unique sources of risk and return that increase the diversification of a portfolio, improving its efficiency. The research we reviewed demonstrates that a simple 1/N factor diversification strategy will likely be at least as efficient as more “sophisticated” versions such as mean-variance and minimum variance strategies.
Larry Swedroe is head of financial and economic research for Buckingham Wealth Partners.
For informational and educational purposes only and should not be construed as specific investment, accounting, legal, or tax advice. Certain information is deemed reliable, but its accuracy and completeness cannot be guaranteed. Third-party information may become outdated or otherwise superseded without notice. By clicking on any of the links above, you acknowledge that they are solely for your convenience, and do not necessarily imply any affiliations, sponsorships, endorsements or representations whatsoever by us regarding third-party websites. We are not responsible for the content, availability or privacy policies of these sites, and shall not be responsible or liable for any information, opinions, advice, products or services available on or through them. The opinions expressed by featured authors are their own and may not accurately reflect those of Buckingham Strategic Wealth® or Buckingham Strategic Partners®, collectively Buckingham Wealth Partners. Neither the Securities and Exchange Commission (SEC) nor any other federal or state agency have approved, determined the accuracy, or confirmed the adequacy of this document. LSR-23-438
About the Author: Larry Swedroe
—
Important Disclosures
For informational and educational purposes only and should not be construed as specific investment, accounting, legal, or tax advice. Certain information is deemed to be reliable, but its accuracy and completeness cannot be guaranteed. Third party information may become outdated or otherwise superseded without notice. Neither the Securities and Exchange Commission (SEC) nor any other federal or state agency has approved, determined the accuracy, or confirmed the adequacy of this article.
The views and opinions expressed herein are those of the author and do not necessarily reflect the views of Alpha Architect, its affiliates or its employees. Our full disclosures are available here. Definitions of common statistics used in our analysis are available here (towards the bottom).
Join thousands of other readers and subscribe to our blog.