Over the almost 100 years that we have had data for U.S. stocks, the value premium (the annual average difference in returns, relative to accounting measures, from buying stocks whose market prices are low versus stocks whose market prices are high) has averaged 4.4% per year (when using book-to-market [HML: high minus low] as the valuation metric). In our book “Your Complete Guide to Factor-Based Investing,” Andrew Berkin and I presented the evidence demonstrating that the value premium was persistent across time and economic regimes, pervasive around the globe, robust to various definitions, survived transactions costs, and had both risk and behavioral explanations for why investors should expect the premium to persist in the future. Thus, the finding of a value premium was highly unlikely to be the result of data mining exercises. However, while value returns have been high on average, the strategy is far from riskless.
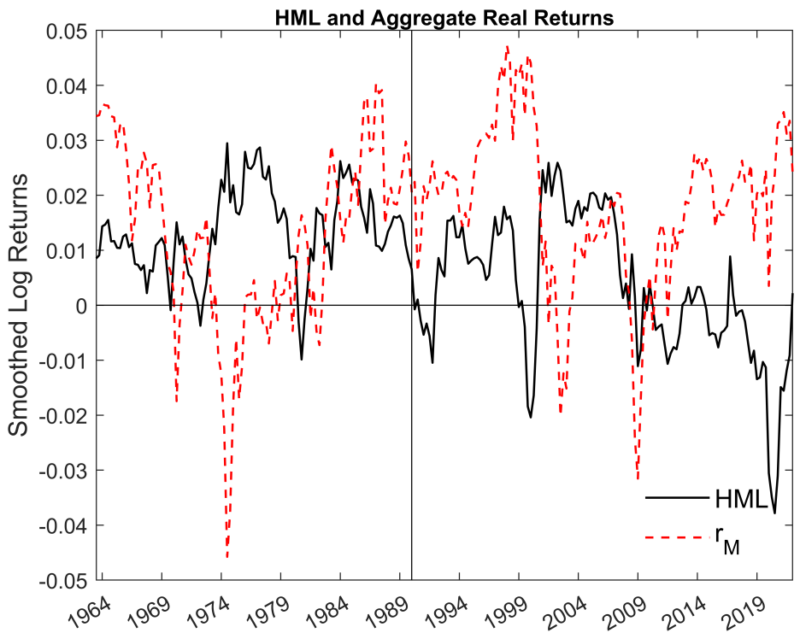
The following chart shows that the value premium (HML) has experienced multiple booms (the late 1970s, mid-1980s, and early to mid-2000s) and multiple crashes (the early 1970s, the early 1980s, the early and late 1990s, the Great Recession of 2008-09, and the largest drawdown ever from November 2016 through October 2020). Also, there has been little correlation between HML returns and the returns to the market.
The results are hypothetical results and are NOT an indicator of future results and do NOT represent returns that any investor actually attained. Indexes are unmanaged and do not reflect management or trading fees, and one cannot invest directly in an index.
The chart also shows that the market premium experienced multiple booms and crashes like the value premium. In other words, crashes are not unique to the value premium—they occur in all risk assets (or there would be no risk and no risk premium).
Drivers of Value’s Booms and Busts
John Campbell, Stefano Giglio, and Christopher Polk, authors of the March 2023 study “What Drives Booms and Busts in Value?,” sought to determine which factors drive value’s booms and busts. They interpreted the returns to the standard value strategy through the lens of Robert Merton’s intertemporal CAPM (ICAPM). In this model, the shocks that move value returns are:
- Shocks to the expected cash flows of the aggregate stock market (in their 2022 study “Bad Beta, Good Beta, authors John Campbell and Tuomo Vuolteenaho called this “bad beta”).
- Shocks to the discount rates applied to those cash flows (they called this “good beta”).
- Shocks to the variance (volatility) of aggregate market returns—the VIX plays an essential role in the value of the market portfolio.
Campbell and Vuolteenaho explained:
“The value of the market portfolio may fall because investors receive bad news about future cash flows, but it may also fall because investors increase the discount rate or cost of capital that they apply to these cash flows. In the first case, wealth decreases and investment opportunities are unchanged, while in the second case, wealth decreases but future investment opportunities improve.”
They went on to explain that intertemporal asset pricing theory suggests that the shocks to expected cash flow should have a higher price of risk; thus beta, like cholesterol, comes in “bad” and “good” varieties. The explanation for the higher price of risk for cash-flow shocks is that investors demand a higher premium to hold assets that covary with the market’s cash-flow news than to hold assets that covary with news about the market’s discount rates because improved prospects partially compensate poor returns driven by increases in discount rates for future returns.
In their study, Campbell, Giglio, and Polk found that value stocks (and small stocks) have considerably higher cash-flow betas than growth stocks and large stocks, explaining their higher average returns. They also found that “value stocks have higher cash-flow betas but lower discount-rate betas [this pattern may reflect the lower duration of value stocks, whose cash flows are concentrated in the near term relative to growth stocks] and overall market betas than growth stocks.”
They also stated that, according to the Campbell and Vuolteenaho model, “Value stocks are likely to underperform when the aggregate market is driven down by bad cash flow news, but also in a period when the market is driven up by declining discount rates. There doesn’t’ need to be q strong unconditional relationship between value returns and aggregate stock returns since both shocks affect the aggregate market.” In addition, John Campbell, Stefano Giglio, Christopher Polk, and Robert Turley, authors of the 2022 study “An Intertemporal CAPM with Stochastic Volatility,” found that “a period with unusual upward shocks to volatility is likely to be a period in which value underperforms.”
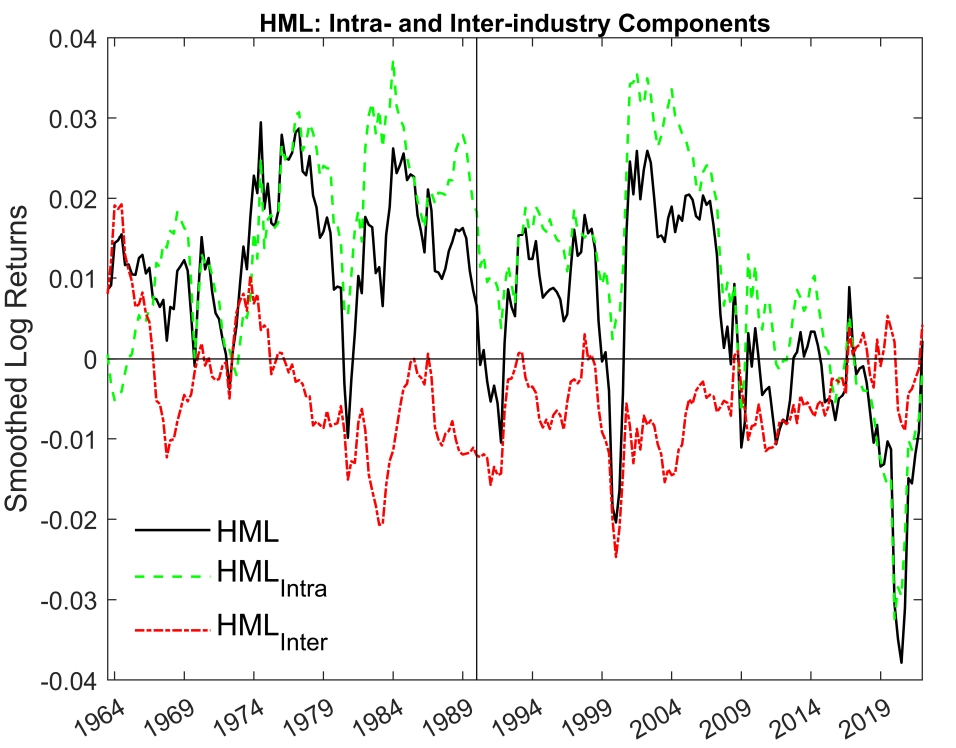
As part of their analyses, Campbell, Giglio, and Polk created an intra-industry value strategy (HMLIntra) that held stocks whose book-to-market ratios were high relative to other stocks in the same industry. Thus, HML consisted of two components: HMLIntra and interindustry HML (HMLInter). The six variables used for expected cash flows were: the log real return on the market; the expected market variance; the log of the S&P 500 price-smoothed earnings ratio, where earnings are smoothed over ten years; the term yield spread, measured as the difference between the log yield on 10-year Treasuries and the log yield on 3-month Treasuries; the small-stock value spread; and the default spread, defined as the difference between the log yield on Moody’s BAA and AAA bonds. Their data sample covered the period from the first quarter of 1963 through the first quarter of 2022.
Following is a summary of their findings:
- Most of the variation in aggregate returns came from discount-rate news.
- HML was weakly negatively related to the market (beta -0.17), and the correlation was only 5%—exposure to the market alone was insufficient to understand HML’s fluctuations. The same was true for HMLIntra and HMLInter.
- Value booms and busts did not line up with returns on the aggregate stock market (see Figure 1 above), as some periods saw offsetting effects of the different news terms (for example, in the 70s, when discount rate and variance news contributed positively to the HML and HMLIntra returns, while cash flow news contributed negatively). At other times, all three news terms pushed HML’s return in the same direction (for example, positively in the 2000s before the financial crisis and negatively during the COVID-19 crash).
- Earlier value busts coincided with high aggregate stock returns, but value busts in the Great Recession and the COVID-19 pandemic coincided with sharp declines in the aggregate market.
- Cash-flow news was positively correlated with negative discount-rate news—positive cash-flow shocks were associated with declines in discount rates that amplified the response of stock prices.
- Cash-flow news was negatively correlated with variance news—positive cash-flow shocks were associated with reductions in equity market risk.
- Value booms and busts primarily resulted from returns to value within industries.
- While there was no correlation between intra-industry and interindustry HML (see Figure 2 below), many value busts coincided with poor returns to interindustry HML.
- Intra-industry HML had a considerably higher cash-flow beta and much lower volatility beta than interindustry HML—since cash-flow and volatility betas are highly compensated in the ICAPM, this pattern helps explain the higher average return to intra-industry HML than to interindustry HML.
The results are hypothetical results and are NOT an indicator of future results and do NOT represent returns that any investor actually attained. Indexes are unmanaged and do not reflect management or trading fees, and one cannot invest directly in an index.
- Over the period 1963Q3-2022Q1, the quarterly risk premia for HML, HMLIntra, and HMLInter was 0.93%, 1.37%, and -0.44% per quarter, respectively. The HML risk premium was positive (and statistically significant) over the modern sample despite the lower premium earned by value over the last 15 years. However, the HML premium could be entirely attributed to the intra-industry component. In contrast, the interindustry component had no significant risk premium—the intra-industry component was highly priced by investors.
- Over the entire sample period, the three ICAPM shocks explained almost half (48%) of the variance of HML, 40% of the variance of intra-industry HML, but only 16% of the variance of inter-industry HML. In a more recent sample period starting in 1990, the explanatory power of the ICAPM was again 48% for HML and somewhat higher for intra-industry HML, at 45%. The ICAPM fit improved for interindustry HML in this period but remained modest, at 26%.
- All the patterns continued to hold when they examined the pre-1990 and post-1990 samples separately.
Their findings led Campbell, Giglio, and Polk to conclude: “The ICAPM, in stark contrast to the static CAPM, explains a significant portion of the realized returns on value-minus-growth strategies and thus can justify the large swings in the fortunes of value investors over the last 60 years. A key implication of the ICAPM is that investors price exposure to three main sources of risk, captured by cash-flow news, discount-rate news, and volatility news.” They added: “We find that the ICAPM does a much better job explaining the realized returns on the intra-industry component of a value-minus-growth bet. Moreover, intra-industry value is especially sensitive to cash-flow and volatility news, the two ICAPM factors that command a much higher risk premium. In contrast, the ICAPM does not explain inter-industry value as well, and any explanatory power comes primarily from discount-rate news, the ICAPM factor that commands a much lower risk premium.”
Investor Takeaways
Campbell, Giglio, and Polk provided clear risk-based explanations for the value premium— shocks to the expected cash flows of the aggregate stock market, shocks to the discount rates applied to those cash flows, and shocks to the variance (volatility) of aggregate market returns. Their evidence provided explanations for the booms and busts in the value premium. Unfortunately, by definition, shocks are surprises, unexpected events. That makes trying to time the value premium difficult.
With that said, the empirical evidence from studies such as “Macro-Finance and Factor Timing: Time-Varying Factor Risk and Price of Risk Premiums (2018),” “Strategies Can Be Expensive Too! The Value Spread and Asset Allocation in Global Equity Markets (2019),” and “Value Return Predictability Across Asset Classes and Commonalities in Risk Premia (2019)” demonstrates that value spreads (the ratio of the valuation of value stocks relative to growth stocks) widen when risk aversion is high (when discount rates and thus expected value returns are high). Thus, the spread provides information about the future value premium in equities and across asset classes. That makes it tempting to try to time the premium. However, history provides examples of historically wide spreads getting even wider for extended periods—as was the case in the dark winter for value stocks from November 2016 through October 2020. Thus, timing the premium can be “fraught with opportunity.” Studies such as “Contrarian Factor Timing Is Deceptively Difficult (2017),” “Factor Exposure Variation and Mutual Fund Performance (2018),” and “Factor Timing: Keep It Simple (2021)” have found lackluster results when they investigated the impact of value timing—whether dynamic allocations can improve the performance of a diversified multi-style portfolio.
Because strategic diversification is a challenging benchmark to beat, and tactical value timing can reduce diversification and detract from the performance of a multi-style strategy that already includes value, investors are best served by staying disciplined, adhering to their asset allocation, and rebalancing plan. That will increase exposure to the value premium when spreads widen and the expected premium is greater.
Campbell, Giglio, and Polk also showed that while the classic value strategy bets on the convergence of valuation ratios across and within industries, the intra-industry component of such a bet typically contributes much more to value’s average outperformance. Thus, investors building value-oriented portfolios might want to consider funds that are industry neutral.
Larry Swedroe is head of financial and economic research for Buckingham Wealth Partners.
For informational and educational purposes only and should not be construed as specific investment, accounting, legal, or tax advice. Certain information is based on third party data and may become outdated or otherwise superseded without notice. Third party information is deemed to be reliable, but its accuracy and completeness cannot be guaranteed. By clicking on any of the links above, you acknowledge that they are solely for your convenience, and do not necessarily imply any affiliations, sponsorships, endorsements or representations whatsoever by us regarding third-party websites. We are not responsible for the content, availability or privacy policies of these sites, and shall not be responsible or liable for any information, opinions, advice, products or services available on or through them. The opinions expressed here are their own and may not accurately reflect those of Buckingham Strategic Wealth, LLC or any of its affiliates. Neither the Securities and Exchange Commission (SEC) nor any other federal or state agency have approved, determined the accuracy, or confirmed the adequacy of this article. LSR-23-476
About the Author: Larry Swedroe
—
Important Disclosures
For informational and educational purposes only and should not be construed as specific investment, accounting, legal, or tax advice. Certain information is deemed to be reliable, but its accuracy and completeness cannot be guaranteed. Third party information may become outdated or otherwise superseded without notice. Neither the Securities and Exchange Commission (SEC) nor any other federal or state agency has approved, determined the accuracy, or confirmed the adequacy of this article.
The views and opinions expressed herein are those of the author and do not necessarily reflect the views of Alpha Architect, its affiliates or its employees. Our full disclosures are available here. Definitions of common statistics used in our analysis are available here (towards the bottom).
Join thousands of other readers and subscribe to our blog.