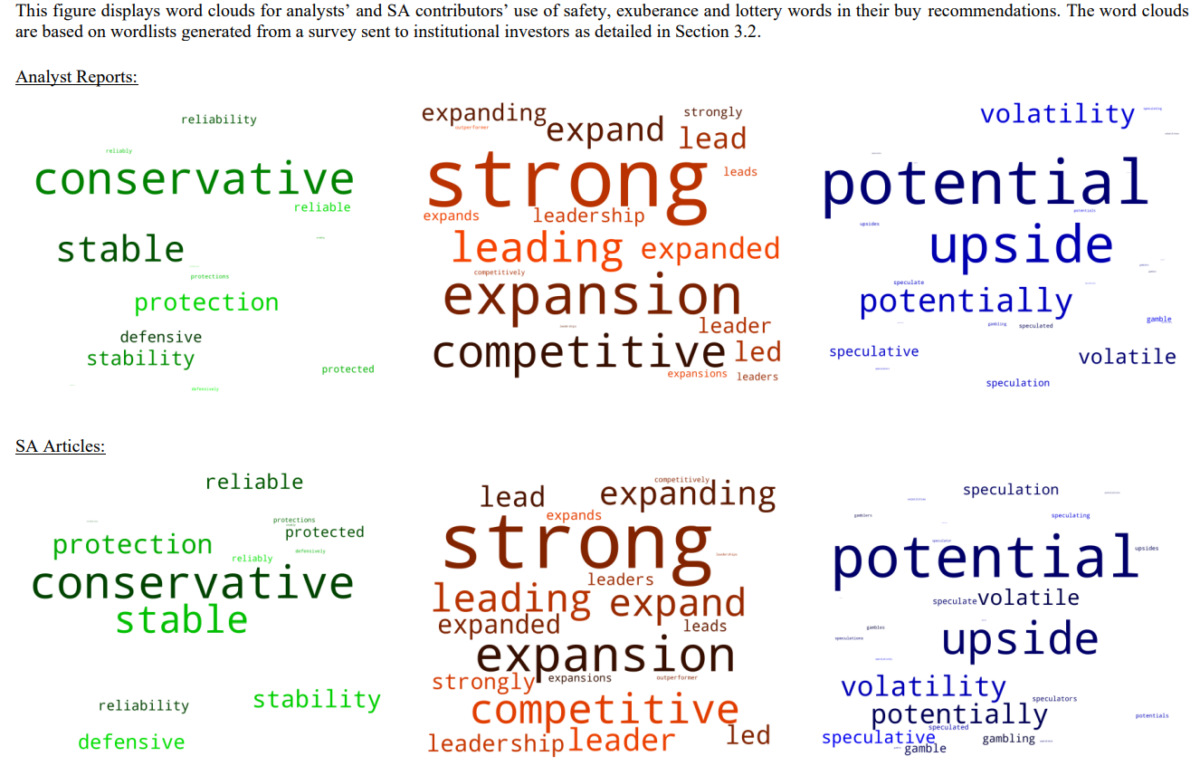
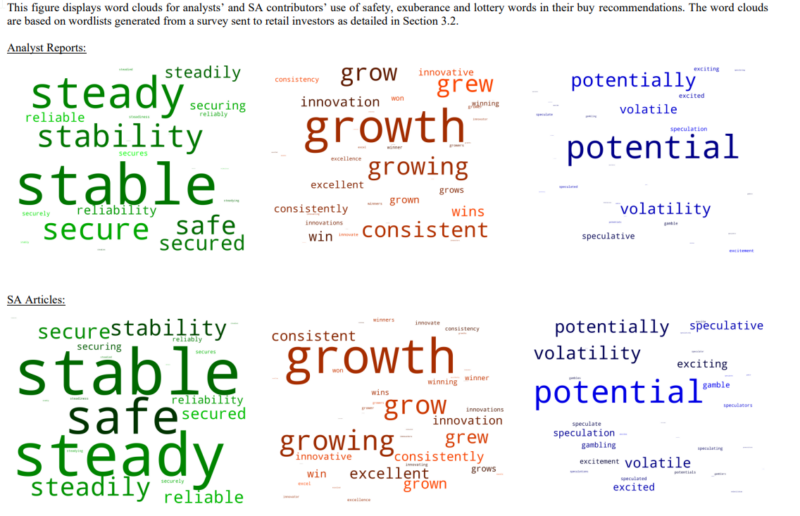
Financial literature has produced a long list of firm characteristics (referred to as factors) that provide information as to future stock returns, with the explanation for the casual relationship between the characteristics and returns being either risk- or behavioral-based. The traditional finance (risk-based) explanation is that stocks with certain characteristics tend to perform worse when the marginal utility of money is high (such as in recessions, when unemployment is high and labor capital is at risk). Thus, investors demand a risk premium in return for accepting the risks of firms (companies on the long side of a factor) with such characteristics. On the flip side (companies on the short side of a factor), investors rationally pay a high price and accept low average returns for stocks that provide insurance against bad economic regimes.
There are two categories of behavioral-based explanations: behavioral errors that lead to mispricing and a taste-based explanation. The behavioral explanation is that certain firm characteristics correlate with, or induce, overly optimistic beliefs. Overly optimistic beliefs can arise from investors’ extrapolation of past cash-flow growth or stock market performance (recency bias) and overconfidence. In the presence of limits to arbitrage, overly optimistic beliefs generate overpricing. Since overpricing is eventually corrected, these characteristics predict low future stock returns. The taste-based explanation is that investors prefer (they derive utility from) extreme payoffs even if the probability of receiving such payoffs is exceedingly small, causing them to overpay (from a purely economic perspective) for assets with a lottery-like distribution of returns.
Differentiating Between Risk and Behavioral Explanations
Hailiang Chen, Byoung-Hyoun Hwang and Zhuozhen Peng, authors of the January 2023 study “Inside the Minds of Expected Stock Returns,” proposed a method for differentiating between the risk-based and the two behavioral-based explanations. They conducted textual analysis on sell-side analyst reports and online stock opinion articles (which recommend investors buy stocks that, based on prior literature, trade at comparatively high prices and earn low average returns) to determine whether the justifications provided in these buy recommendations mostly (1) emphasized a stock’s safe-haven quality (avoiding stocks that perform poorly when the marginal utility of wealth is high), (2) indicate investor exuberance, or (3) point to a preference for stocks with high upside potential.
Their data sample was split into two parts. The first covered the texts of 1,171,055 sell-side analyst reports on 6,130 individual stocks in the U.S. over the period January 2006 – October 2021. Their second source of stock opinion articles was Seeking Alpha (SA), a leading investments-related website, where a team of editors curate submissions. If the articles are deemed of adequate quality and published on the SA website, the authors receive income based on the article type and the number of pageviews their articles generate. SA reported that, as of March 2019, its website attracted more than 15 million unique visitors a month; its audience, 65% of whom traded at least once a month, had an average household income of $321,302. The authors compiled 140,420 SA articles on 5,718 individual stocks trading in the U.S. The sample spanned the same time period as the analyst sample.
Chen, Hwang and Peng noted: “While we view analyst reports as reflecting primarily institutional investors’ opinions, we view SA articles as capturing mostly retail investors’ opinions.” Their analysis covered 205 firm-level characteristics found in the literature to test which of the three explanations had the most explanatory power. To assess whether investors fixate on a stock’s safe-haven quality, a stock’s excellence or a stock’s perceived upside potential, they adopted a dictionary-based textual analysis approach, creating:
- A list of words they thought investors would use to highlight a stock’s safe-haven status (“safety words”),
- A list of words investors would use to emphasize a stock’s superiority (“exuberance words”),
- A list of words investors would use to describe a stock’s lottery-like features (“lottery words”).
They then tested whether words from any of these three lists appeared unusually frequently in analysts’ and SA contributors’ buy recommendations for securities in the short leg of the factor (characteristic).
To create their three wordlists, they recruited 100 U.S.-based institutional investors and asked them to list five words they would use to describe (1) “a stock that, to you, is a ‘safe-haven asset’: a stock that does relatively well when times are bad”; (2) “a stock that has been doing well and that you expect will continue to do very well or, in general, a stock that you are very confident will earn above-normal returns”; and (3) “a stock that offers somewhat of a gamble: the stock will most likely not produce above-normal returns, but, if it does, the payoff will be enormous.” For each question, they selected the five most frequently mentioned terms. Their five safety terms were conservative, defensive, protection, reliable and stable. Their five exuberance terms were competitive, expanding, leader, outperformer and strong. And their five lottery terms were gamble, potential, speculative, upside and volatile. They sent an almost identical version of the institutional investor survey to 303 U.S. retail investors. Their final retail investor wordlists included 29 safety words, 42 exuberance words and 40 lottery words.


Following is a summary of their findings:
- Analyst reports more frequently used lottery words when discussing highly idiosyncratic risk stocks than when discussing stocks that do not have high idiosyncratic risk: the fraction of lottery words was 19% higher (t-stat = 36).
- SA articles also more frequently used lottery words when discussing stocks with high idiosyncratic risk (26%, t-stat = 16).
- There were no reliable differences in the use of safety or exuberance words.
- For both sell-side analysts and SA, the buy recommendations for stocks with low operating leverage stood out for their unusually heavy use of safety words, and there was no abnormal use of exuberance or lottery words.
- For both sell-side and SA, buy recommendations for stocks with high returns over the past three years had abnormally heavy use of exuberance words and no abnormal use of safety words. There was some abnormal use of lottery words in analyst reports but not in SA articles.
- There was abnormally high use of lottery words in stocks with low profitability, stocks with high failure probability, stocks with high short interest, and stocks with poor recent returns.
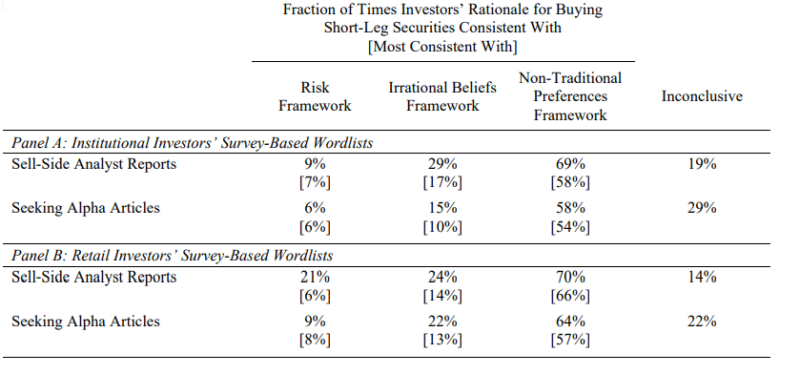
- Analysts’ rationales for liking short-leg securities were most consistent with the risk framework for 12 out of the 181 firm characteristics (7% of the time) – buy recommendations for short-leg securities most notably stood out for their heavy reliance on safety words.
The following table shows the fractions of times investors’ rationales for buying short-leg securities was consistent (most consistent) with traditional risk framework, irrational beliefs framework, or non-traditional preferences framework.

Their findings led Chen, Hwang and Peng to conclude: “The abnormal use of lottery words in the buy recommendations for high idiosyncratic risk stocks, combined with the lack of reliable differences in the use of safety and exuberance words, suggests that investors particularly like the upside potential they see in these stocks. Coupled with investors’ prospect theory preferences, this perception may help explain why stocks with high idiosyncratic risk trade at comparatively high prices and earn low returns on average.” They added: “Investors view unlevered stocks as particularly safe, which may explain why these stocks trade at comparatively high prices and earn low returns on average. … Overall, a comparison of the fractions suggests that while all three frameworks explain components of the cross-section of expected stock returns, non-traditional investor preferences offer the most comprehensive explanation.” And finally, they found that their “results rooted in the retail investor wordlists point even more strongly to the relevance of non-traditional preferences.”
Of interest is that Chen, Hwang and Peng’s findings are consistent with those of Tobias Moskowitz and Kaushik Vasudevan, authors of the 2022 study “Betting Without Beta,” who analyzed the sports-betting market to test whether the low returns associated with betting on underdogs came from irrational beliefs or non-traditional preferences. Their findings suggest that “preferences for lottery-like payoffs, rather than incorrect beliefs, drive the lower returns to betting on risky underdogs versus safe favorites. … Drawing parallels to low-risk anomalies in financial markets, we find the magnitude of pricing effects matches those in options and equity markets, with a model of lottery preferences providing a unifying explanation.”
Investor Takeaways
Chen, Hwang and Peng’s findings all point to the conclusion that non-traditional investor preferences play an important role in explaining the cross-section of expected stock returns—sell-side analysts and SA contributors like short-leg securities primarily for their upside potential, suggesting that prospect theory is an important determinant of the cross-section of expected stock returns.
While behavioral explanations can, in theory, be arbitraged away, there are significant limits to arbitrage that prevent sophisticated investors from correcting overpricing. The recent GameStop episode in which retail investors banded together to engineer a short squeeze demonstrated just how risky shorting can be, with the potential for unlimited losses. Compounding the risks of shorting is that, with the dramatic increase in market share of passive investment vehicles, markets have become less liquid and thus more inelastic and volatile. The reduced liquidity increases the risk of shorting. The result is that limits to arbitrage have increased, allowing for more overpricing of “high sentiment” stocks, making the market less efficient and increasing the likelihood of bubbles occurring in the future, as overvaluation is more likely to persist.
Another takeaway for investors seeking to build efficient portfolios is to avoid stocks with lottery-like characteristics.
Larry Swedroe is head of financial and economic research for Buckingham Wealth Partners.
For informational and educational purposes only and should not be construed as specific investment, accounting, legal, or tax advice. Certain information is based upon third party data which may become outdated or otherwise superseded without notice. Third party information is deemed to be reliable, but its accuracy and completeness cannot be guaranteed. Indices are not available for direct investment. Their performance does not reflect the expenses associated with the management of an actual portfolio nor do indices represent results of actual trading. Information from sources deemed reliable, but its accuracy cannot be guaranteed. By clicking on any of the links above, you acknowledge that they are solely for your convenience, and do not necessarily imply any affiliations, sponsorships, endorsements or representations whatsoever by us regarding third-party websites. We are not responsible for the content, availability or privacy policies of these sites, and shall not be responsible or liable for any information, opinions, advice, products or services available on or through them. The opinions expressed by featured authors are their own and may not accurately reflect those of Buckingham Strategic Wealth® or Buckingham Strategic Partners®, collectively Buckingham Wealth Partners. Neither the Securities and Exchange Commission (SEC) nor any other federal or state agency have approved, determined the accuracy, or confirmed the adequacy of this article. LSR-22-445
About the Author: Larry Swedroe
—
Important Disclosures
For informational and educational purposes only and should not be construed as specific investment, accounting, legal, or tax advice. Certain information is deemed to be reliable, but its accuracy and completeness cannot be guaranteed. Third party information may become outdated or otherwise superseded without notice. Neither the Securities and Exchange Commission (SEC) nor any other federal or state agency has approved, determined the accuracy, or confirmed the adequacy of this article.
The views and opinions expressed herein are those of the author and do not necessarily reflect the views of Alpha Architect, its affiliates or its employees. Our full disclosures are available here. Definitions of common statistics used in our analysis are available here (towards the bottom).
Join thousands of other readers and subscribe to our blog.

