The empirical evidence from studies such as the 2017 paper “A Century of Evidence on Trend-Following Investing” and the 2020 paper “Time Series Momentum in the US Stock Market: Empirical Evidence and Theoretical Analysis” has found that time-series momentum (TSMOM) has demonstrated above-average excess returns in stocks, bonds, commodities, and currencies. Also called trend momentum or trend following, it is measured by a portfolio that is long assets that have had recent positive returns (for example, the past year) and short assets that have had recent negative returns. The academic evidence suggests that including a strategy targeting TSMOM in a portfolio improves the portfolio’s risk-adjusted returns, mainly if the strategy also targets a constant level of (scales for) volatility. Notably, the strategy shows low correlations to traditional asset classes, providing a diversification benefit.
The literature has also found that while past recent winners (losers) tend to continue to outperform (underperform) over the longer term, reversals tend to occur (behavioralists explain that it is a result of investor overreaction). The original research on long-term reversal in U.S. equities, “Does the Stock Market Overreact?,” was published by Werner De Bondt and Richard Thaler in 1985 and has become one of the most ubiquitous asset-pricing anomalies documented. It has been demonstrated not only in individual stocks but also in national equity indices, futures, currencies, and commodities (for example, studies such as the 2017 paper “Overreaction and the Cross-section of Returns: International Evidence” and the 2020 paper “The Long-Run Reversal in the Long Run: Insights from Two Centuries of International Equity Returns”).
The empirical findings demonstrate that short-term momentum and reversals coexist in markets. Today, quantitative investment firms focused on momentum strategies typically incorporate reversals into those strategies; most of their models focus on momentum formation periods in the three- to 12-month range.
New Research
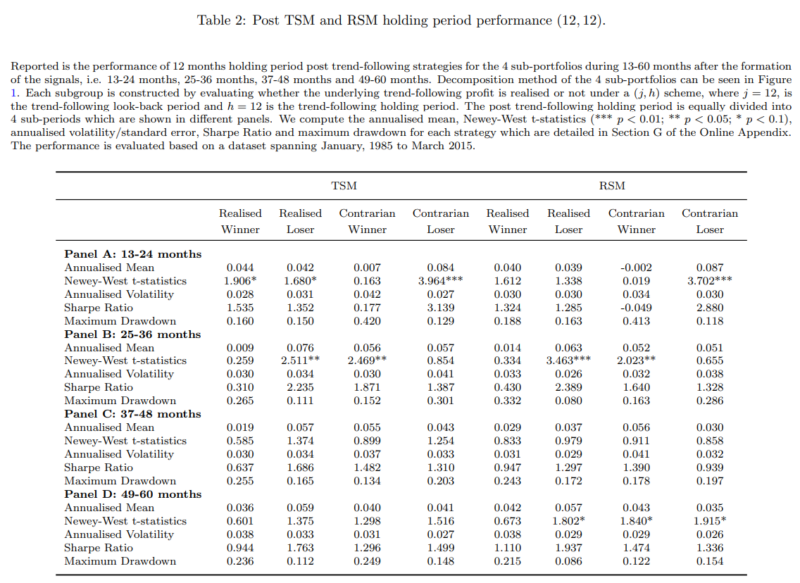
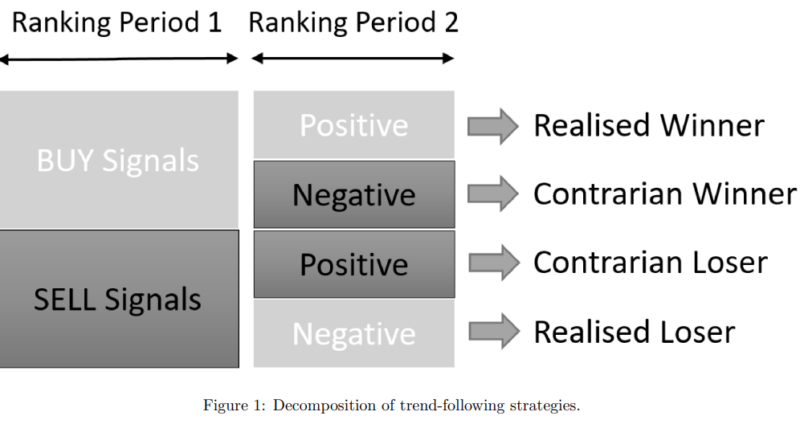
Jiadong Liu and Fotis Papailias contribute to the momentum literature with their study “Time Series Reversal in Trend-Following Strategies,” published in the January 2023 issue of “European Financial Management,” in which they examined the reversal property of various financial assets. They decomposed different trend-following strategies based on a portfolio of 55 of the world’s most liquid commodity and financial futures (24 commodity futures, nine foreign exchange futures, nine equity indexes of developed countries, and 13 government bonds of various maturities for six developed countries). Their data sample covered the period from January 1985-March 2015. Specifically, they classified instruments in trend-following strategies into four groups: “realized winner,” “realized loser,” “contrarian winner,” and “contrarian loser.” The realized winner sub-portfolio consists of instruments with positive trend-following trading signals (winners) whose profits are realized in the subsequent investment horizon (1-12 months). The realized loser sub-portfolio consists of instruments with negative trading signals (losers) that later produce negative returns, meaning that the loser portfolio realizes its profit. By contrast, the contrarian winners and contrarian losers include instruments with positive and negative signals that fail to gain profits. The construction of the four sub-portfolios allowed them to see which part of the trend-following returns contributed most to time series reversal. Following procedure from prior literature on time series momentum, when investigating the profitability of the trend-following reversal strategies, they implemented a volatility scaling approach to weight the portfolio using a target value for the annual volatility of 40%.
Following is a summary of their key findings:
- Time-series momentum and reversal did not occur in the same group of assets.
- Loser sub-portfolios, no matter whether their profits were realized or not (realized losers and contrarian losers), experienced a strong subsequent reversal. By contrast, the results from the winner subgroups led to mixed answers: The realized winners exhibited strong reversal, while the contrarian winners did not—the positive returns generated by the realized winner and the realized loser offset each other when considered together. On the other hand, the loser subgroups, especially the contrarian losers, contributed the most to the time series reversal.
The timing of time series reversal occurred from 12 to 24 months after the portfolio formation. This finding differs from the traditional cross-sectional reversals, which usually last longer, between two and five years after the portfolio formation date.
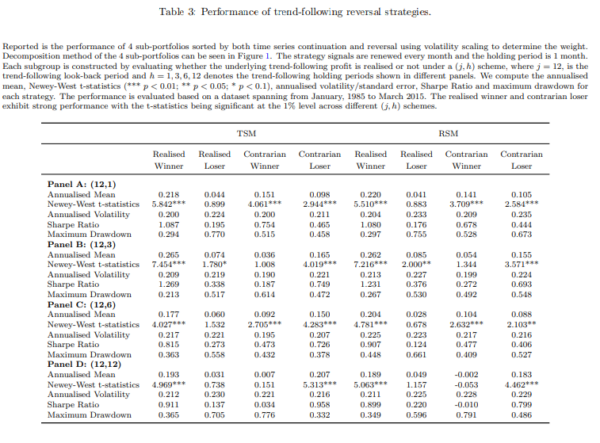
Based on these results, Liu and Papailias constructed a double-sorted trading strategy, holding the four previously mentioned decompositions of trend-following strategies. They called this “trend-following reversal strategy” because it combined time series continuation and reversal. For every single asset, they first sorted on the 12-month returns skipping the most recent 12 months (ranking period 1), and second sorted on the recent 12-month returns (ranking period 2), and then invested in the following month. For instance, a realized winner strategy contained assets with positive returns in both ranking periods 1 and 2.
They found:
- Trend-following reversal strategies suggest that investors only took a long position in the realized winner and contrarian loser sub-portfolios. The realized winner and the contrarian loser sub-portfolios produced statistically significant returns at the 1% level in all cases regardless of the trend-following strategies and the ranking scheme chosen. The annualized mean returns of the realized winners ranged from 14.4% to 26.6%, and the returns of the contrarian losers ranged from 9.8% to 24.4%.
- Holding the realized winner and the contrarian loser subgroups yielded annualized returns as high as 22% and 24%, respectively. The authors noted: “These strategies are liquid and well diversified in the context of real market trading.”
- The average returns remained stable after a holding period of more than 24 months—the reversal pattern stopped after the end of the second year. The realized winners and the contrarian winners, which were supposed to produce high returns (with buy signals), no longer earned significant profits after the trend-following holding period. On the other hand, the realized losers and the contrarian losers generated high returns, indicating a strong reversal. Among the four subgroups, the contrarian loser subgroup showed the most robust reversal during the 13- to 24-month period, while the contrarian winners did not.
The contrarian loser represented an effective strategy for investors to avoid momentum risks due to its low correlation with trend-following factors.
Their findings led Liu and Papailias to conclude: “Momentum and reversal should be treated as separate effects.”
Liu and Papailias contributed to the literature by showing that time series reversal usually occurs between 12 and 24 months after forming trend-following strategies, much shorter than the findings documented in the cross-sectional reversal literature. They also demonstrated which trend-following components contributed most to the reversal profits. And finally, they showed that a trend-following reversal strategy earned significant abnormal returns based on time series continuation and reversal.
Larry Swedroe is head of financial and economic research for Buckingham Wealth Partners.
For informational and educational purposes only and should not be construed as specific investment, accounting, legal, or tax advice. Certain information is based on third party data and may become outdated or otherwise superseded without notice. Third party information is deemed to be reliable, but its accuracy and completeness cannot be guaranteed. By clicking on any of the links above, you acknowledge that they are solely for your convenience, and do not necessarily imply any affiliations, sponsorships, endorsements or representations whatsoever by us regarding third-party websites. We are not responsible for the content, availability, or privacy policies of these sites, and shall not be responsible or liable for any information, opinions, advice, products or services available on or through them. Neither the Securities and Exchange Commission (SEC) nor any other federal or state agency have approved, determined the accuracy, or confirmed adequacy of this article. The opinions expressed here are their own and may not accurately reflect those of Buckingham Strategic Wealth, LLC or any of its affiliates. LSR-23-468
About the Author: Larry Swedroe
—
Important Disclosures
For informational and educational purposes only and should not be construed as specific investment, accounting, legal, or tax advice. Certain information is deemed to be reliable, but its accuracy and completeness cannot be guaranteed. Third party information may become outdated or otherwise superseded without notice. Neither the Securities and Exchange Commission (SEC) nor any other federal or state agency has approved, determined the accuracy, or confirmed the adequacy of this article.
The views and opinions expressed herein are those of the author and do not necessarily reflect the views of Alpha Architect, its affiliates or its employees. Our full disclosures are available here. Definitions of common statistics used in our analysis are available here (towards the bottom).
Join thousands of other readers and subscribe to our blog.