Negative exclusionary screening refers to an investment strategy in which socially controversial firms in particular sectors are excluded from the portfolio. The Global Sustainable Investment Review reports that, in 2020, more than $15 trillion (43% of total sustainable investments) were invested using negative screening. The most common negative screen employed is excluding “sin” stocks, a term used for companies that make money from exploiting human weaknesses and vices and generally include firms in the tobacco, alcohol, gambling, and adult entertainment industries. Negative screening has increased—the gap of institutional ownership between non-sin stocks and sin stocks grew from 4.3% from 2000-2009 to 7.9% from 2010-2019.
Hamid Boustanifar and Patrick Schwarz contribute to the sustainable investing literature with their March 2023 study “Measuring Business Social Irresponsibility: The Case of Sin Stocks,” in which they examined the impact of negative screening of sin stocks. They noted that the prior literature identifies sin stocks based on industry classification codes (IC) assigned to companies by data providers (such as Compustat or CRSP). Although identifying sin stocks based on the IC method is simple, it has several significant shortcomings. “First, industry classifications are somewhat arbitrary. For example, the four-digit SIC codes assigned by CRSP and Compustat match only for 32% of companies during our sample from 1996 to 2021. Consistently, sin indicators created based on industry codes from CRSP and Compustat have a correlation of only 0.80.”
A second issue is that the IC method yields a binary outcome—a firm would be classified as either sinful or not. This creates a problem when equal weighting as it assumes that all sin stocks are equally sinful—measuring the sin premium as an average across all sin stocks regardless of their degree of exposure to sinful business activities. The problem results from the fact that when value weighting portfolios, a large company is assigned a significant weight even if it has a small sin-related business segment.
To overcome the problems created by the IC method, Boustanifar and Schwarz used an alternative approach based on textual analysis (TA method) of corporate annual reports. They used web crawling to download the universe of annual reports available from the U.S. Securities and Exchange Commission’s Electronic Data Gathering, Analysis, and Retrieval (EDGAR) system. To identify sin stocks, they focused on tobacco, alcohol, gambling, and adult entertainment industries. They created a “sin dictionary” including words and phrases related to each sin industry that were likely to appear in annual reports of firms engaged or exposed to sinful activities—including not only unigrams (single words) but also n-grams (a sequence of n words). Examples from their sin dictionary are tobacco and cigarette for tobacco; alcohol and alcoholic beverages for alcohol; wagering, casino, and gaming industry for gambling; and adult business and sexually explicit for adult entertainment.
Their methodology was based on the simple premise that the higher a firm’s exposure to a particular sin industry, the higher the frequency of sin-related words in its filing. Their analysis was based on 117,250 annual filings for the fiscal years 1996-2021. The number of sin stocks in their TA method was almost twice as large as that obtained using the IC method. They also documented significant issues in identifying sin companies using the IC method:
- They found six major false positive sin stocks based on the IC method and numerous cases of false negative stocks where a company’s business is clearly in a sin industry, but the industry code assigned to the company does not identify it as a sin stock. Even for some well-known sin firms (e.g., Churchill Downs), the IC method identified stocks as sin in some years and not in other years, without any justifiable reason and even though the company’s business had not changed at all.
- The TA method measure reasonably well captures changes in the sinfulness of companies over time within a sin industry (such as a tobacco firm acquiring more tobacco-related businesses) and captured expansions to other sin industries (such as an alcohol company expanding to the tobacco industry). Furthermore, unlike the IC method, the TA approach identified nine unique companies in the adult entertainment industry.
Boustanifar and Schwarz used the TA method to investigate the existence of the sin premium using equal- and value-weighted portfolios as well as their sin-weighted portfolio. Sin weights were computed using the sinfulness measure obtained from the frequency of sin-related words in the filings. In a sin-weighted portfolio, companies more exposed to sinful business activities receive a higher weight in the portfolio construction. Following is a summary of their key findings:
- Sin stocks have become much lower in number but larger over the past three decades.
- While most sin stocks in the IC method were also identified as sin in the TA method, there were 57 firm-year cases where a company showed up as sin only in the IC method—these were false positive sin stocks as identified in the IC method.

- In some cases, a company’s business changed—either expanding its activities within a sin business or to a new sin industry, or exiting the sin industry entirely (as was the case with Loews, which sold its tobacco company, Lorillard, but still had exposure to tobacco litigation risk due to its previous involvement, and its sinfulness measure was able to reflect this risk).
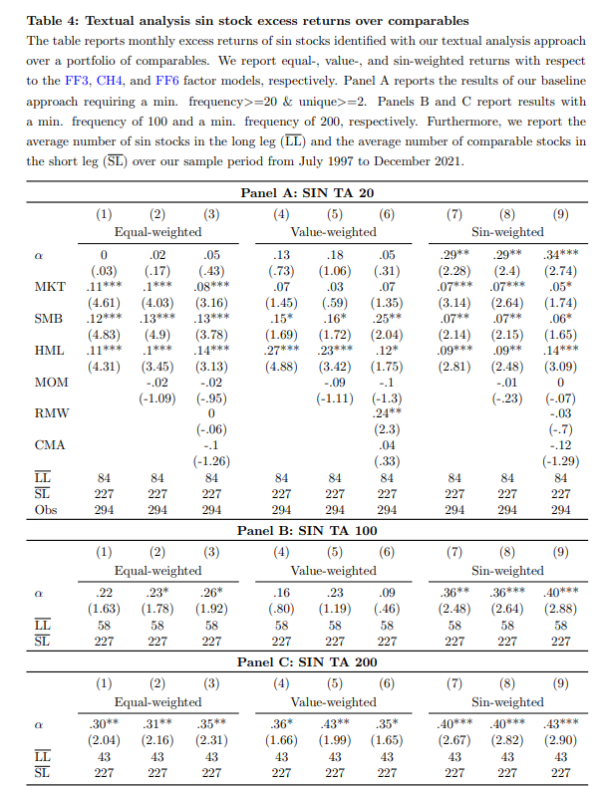
Boustanifar and Schwarz analyzed the performance of equal-weighted (EW) and value-weighted (VW) portfolios against three-factor models: the Fama-French 3-factor model (beta, size, and value); the Carhart 4-factor model (adding momentum); and the Fama-French 6-factor model (adding investment and profitability). They also performed three different analyses, screening for a minimum of at least 20, 100, and 200 sin words. They found:
- On average, there were 84 stocks in the long leg and 227 stocks in the short leg of the portfolios.
- Using a 20 minimum sin word screen, in the EW and VW portfolios of sin stocks identified by the TA method there was no significant sin premium. However, in the sin-weighted portfolio, there was a positive and statistically substantial annual excess return of about 3.5% against the 3- and 4-factor models, and in excess of 4% against the 6-factor model.
- The results were similar using a 100 minimum sin word screen.
- Using a 200 minimum sin word screen, there were statistically significant positive annual excess returns of about 3.5% for the EW portfolio, of between about 4.2% and 5.2% for the VW portfolio, and about 5% in the sin-weighted portfolio.
- Increasing the minimum required sin-related words widened the focus on a subset of highly sinful companies and resulted in an increase in the size of the sin premium.

The results are hypothetical results and are NOT an indicator of future results and do NOT represent returns that any investor actually attained. Indexes are unmanaged and do not reflect management or trading fees, and one cannot invest directly in an index.
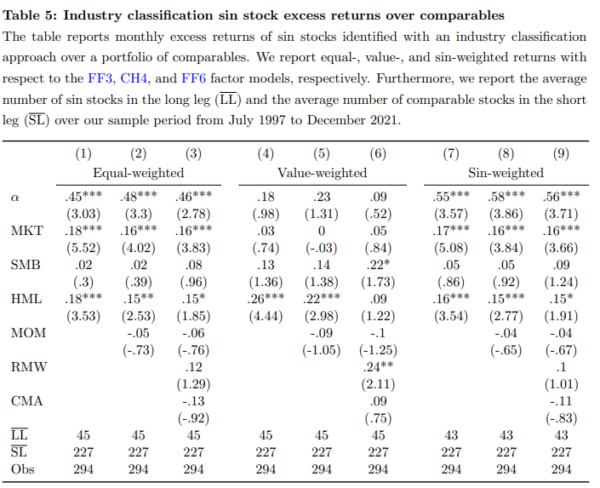
- Using the IC methodology, the sin-weighted portfolios generated even more significant risk-adjusted annual excess returns of between about 6.5% and 7.0% (t-stats significant at the 1% confidence level).

The results are hypothetical results and are NOT an indicator of future results and do NOT represent returns that any investor actually attained. Indexes are unmanaged and do not reflect management or trading fees, and one cannot invest directly in an index.
Their findings led Boustanifar and Schwarz to conclude: “Overall, these results show that the sin premium does exist, i.e., sin stocks have higher expected returns. We document a premium that is substantially larger in magnitude than what was previously estimated, and we demonstrate that it is driven, as it should be, by more sinful companies, not necessarily larger ones. Therefore, focusing on value-weighted portfolios could generate misleading results.” They added: “Our method performs much better than the procedure used in the prior literature, which relies on industry classification codes. Using industry classification codes generates several false positive, numerous false negative sin stocks, and sometimes random time-series variation within a stock (e.g., inconsistent and random jumps back and forth between sin and non-sin classification).”
Investor Takeaways
Boustanifar and Schwarz’s results are in contrast to the results of recent studies, such as “Sin Stocks Revisited: Resolving the Sin Stock Anomaly,” which argued that sin stocks do not earn higher returns after controlling for the Fama-French six factors (market, size, value, momentum, investment, and profitability). Using textual analysis to address the shortcomings of the industry methodology, they demonstrated that the sin premium does exist and is a function of sinfulness.
Boustanifar and Schwarz’s study adds to the rapidly growing literature that uses textual analysis to measure and study difficult-to-measure firm-level metrics such as intangibles, corporate culture, and corporate innovation. Their findings are consistent with economic theory—investors require higher expected returns to hold more sinful stocks. The takeaway is that there is a financial price to pay for choosing the sustainable investing route—reduced risk-adjusted returns and less efficient diversification. However, it’s also important to recognize that for some investors, such financial consequences are not very important or might not play a role at all. For them, their values have greater importance than maximizing risk-adjusted returns. It’s a personal decision as to whether values or returns should drive investment.
For informational and educational purposes only and should not be construed as specific investment, accounting, legal, or tax advice. Certain information is based on third party data and may become outdated or otherwise superseded without notice. Third party information is deemed to be reliable, but its accuracy and completeness cannot be guaranteed. By clicking on any of the links above, you acknowledge that they are solely for your convenience, and do not necessarily imply any affiliations, sponsorships, endorsements or representations whatsoever by us regarding third-party websites. We are not responsible for the content, availability or privacy policies of these sites, and shall not be responsible or liable for any information, opinions, advice, products or services available on or through them. Neither the Securities and Exchange Commission (SEC) nor any other federal or state agency have approved, determined the accuracy, or confirmed the adequacy of this article. LSR-23-489
About the Author: Larry Swedroe
—
Important Disclosures
For informational and educational purposes only and should not be construed as specific investment, accounting, legal, or tax advice. Certain information is deemed to be reliable, but its accuracy and completeness cannot be guaranteed. Third party information may become outdated or otherwise superseded without notice. Neither the Securities and Exchange Commission (SEC) nor any other federal or state agency has approved, determined the accuracy, or confirmed the adequacy of this article.
The views and opinions expressed herein are those of the author and do not necessarily reflect the views of Alpha Architect, its affiliates or its employees. Our full disclosures are available here. Definitions of common statistics used in our analysis are available here (towards the bottom).
Join thousands of other readers and subscribe to our blog.

