Value as an investment strategy has long been popular in both academia and among practitioners and is supported by valuation theory, which provides a framework for identifying the drivers of expected returns: the prices investors pay and the expected future cash flows investors will receive. Unfortunately, theory does not tell us the best way to extract information about expected returns from current market values and proxies for expected cash flows. A simple approach is to look at current market values scaled by proxies for expected future cash flows. Common proxies include P/B, P/E, P/CF, etc. My colleague Sheldon McFarland reviewed new research on the value factor.
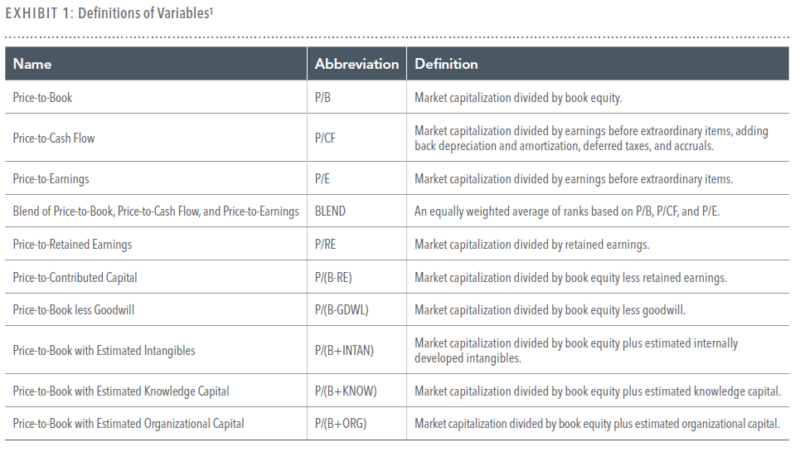
In their April 2023 research paper, “Assessing Alternative Value Metrics,” authors Byung Hyun Ahn and Namiko Saito analyzed the performance of 10 different value metrics proposed in academia and the financial industry. Their objective was to see if a superior choice exists for a practical investment strategy. (a similar paper was published in the JPM and is available here)
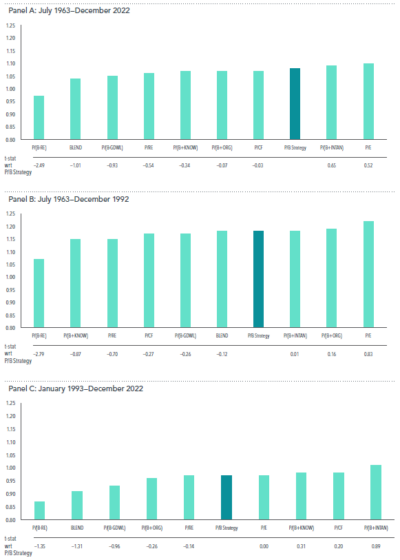
To assess the performance of different value metrics, Ahn and Saito utilized U.S. stock data from July 1963 to December 2022. They compared the historical performance of a hypothetical value portfolio formed on P/B with the performance of nine other hypothetical value portfolios formed on prominent alternative value metrics. Each hypothetical value portfolio targeted the lowest 30% of the U.S. market based on its value metric’s definition.
Ahn and Saito analyzed three sample periods to compare the value metrics: the entire sample period (July 1963-December 2022), the pre-1993 period (July 1963-December 1992), and the post-1993 period (January 1993-December 2022). They compared the average monthly returns, calendar-year returns, and average monthly characteristics of each hypothetical value portfolio to see if a clear value metric winner existed.
Demonstrating the robustness of the value premium, they found that over the entire sample period, all hypothetical value portfolios outperformed the U.S. market’s 0.92% average monthly return. They also found that while some of the alternative value metrics outperformed P/B while others underperformed P/B, none of the differences in performance was statistically significant (other published research comes to different conclusions). Results were similar in the subsample periods except for the pre-1993 period when P/B reliably outperformed P/(B-RE), and the post-1993 period when P/(B+INTAN) reliably outperformed P/B.
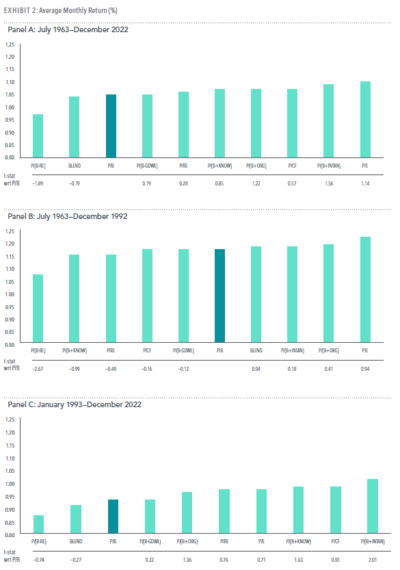
The results are hypothetical results and are NOT an indicator of future results and do NOT represent returns that any investor actually attained. Indexes are unmanaged and do not reflect management or trading fees, and one cannot invest directly in an index.
Looking at the calendar-year returns, the authors found that neither of the value metrics was a consistent winner over time.
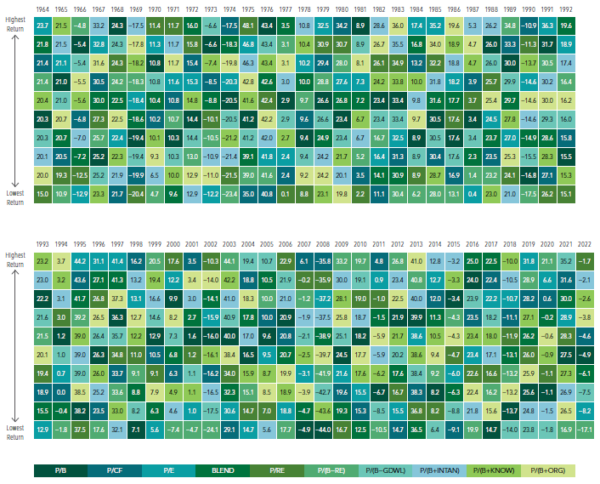
The results are hypothetical results and are NOT an indicator of future results and do NOT represent returns that any investor actually attained. Indexes are unmanaged and do not reflect management or trading fees, and one cannot invest directly in an index.
Examining the average monthly characteristics of the different hypothetical value portfolios, the researchers found that the value metrics provided different levels of profitability exposure, usually at the expense of value exposure, based on the average monthly P/B ratio and average monthly profitability ratio. This phenomenon explained why the hypothetical value portfolios based on the alternative value metrics outperformed the hypothetical value portfolio based on P/B in the post-1993 period when the profitability premium was stronger than the value premium.
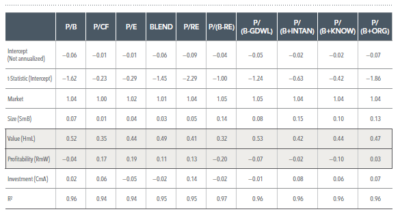
The results are hypothetical results and are NOT an indicator of future results and do NOT represent returns that any investor actually attained. Indexes are unmanaged and do not reflect management or trading fees, and one cannot invest directly in an index.
The researchers showed that these alternative value metrics indirectly exposed the profitability premium and a sector allocation closer to the U.S. market. For example, the hypothetical P/B portfolio had an allocation to the financial sector of 27%, more than twice as much as the U.S. market. On the other hand, the hypothetical portfolio formed on P/CF had a weighting to financials of 16% compared with the market’s 13% weighting.
Ahn and Saito argued that these weightings can be applied more directly by integrating the profitability premium in the weighting scheme and/or security selection and managing sector diversification. They believed a robust real-world value strategy should integrate multiple premiums and provide broad diversification at the security and sector levels.
To support their argument, Ahn and Saito considered a hypothetical value portfolio (P/B strategy) that incorporated the size, value, profitability, and investment premiums while managing sector- and security-level diversification. The strategy focused on the stocks in the market with the lowest P/B ratio. This value universe emphasized stocks with lower P/B, lower market capitalization, and higher profitability and excluded high-investment firms within small caps. The strategy managed sector diversification by limiting the weight of any given sector to at most 10% over its weight in the market, and managed stock diversification by imposing a 5% security cap.
Ahn and Saito showed that such a hypothetical strategy could meaningfully increase the exposure to the profitability premium while maintaining a sharp focus on the value premium. They showed that such a strategy outperformed most of the alternative hypothetical value metric portfolios, and the performance of the P/B strategy improved noticeably in the post-1993 period. (As a side note, it would be interesting to see an analysis of all the valuation metrics with similar adjustments for profitability, weightings, and sector constraints, to get a clean apples-to-apples comparison).
The results are hypothetical results and are NOT an indicator of future results and do NOT represent returns that any investor actually attained. Indexes are unmanaged and do not reflect management or trading fees, and one cannot invest directly in an index.
In the real world, it is important to consider turnover when evaluating different investment strategies because higher turnover can lead to greater implementation costs. Ahn and Saito did that in the paper and found that alternative value metrics generally resulted in higher turnover. This makes sense because metrics based on earnings and cash flows tend to be more volatile than book equity.
Investor takeaways
Valuation and expected returns are complex topics, as many factors can influence them. Understanding valuation theory and recognizing value as a driver of expected return are valuable tools for investors when constructing portfolios.
Although the most efficient way to implement a value strategy may need to be clarified, it is clear that value has withstood the test of time and that some implementations are superior to others. The evidence suggests that P/B is not an efficient metric standalone criterion. Instead, value strategies that use P/B should include at least a measure of profitability while managing sector – and security-level diversification.
For informational and educational purposes only and should not be construed as specific investment, accounting, legal, or tax advice. Certain information is based on third party data and may become outdated or otherwise superseded without notice. Third party information is deemed to be reliable, but its accuracy and completeness cannot be guaranteed. Mentions of specific fund families should not be construed as a recommendation of the fund families or their respective securities offered. By clicking on any of the links above, you acknowledge that they are solely for your convenience, and do not necessarily imply any affiliations, sponsorships, endorsements or representations whatsoever by us regarding third-party websites. We are not responsible for the content, availability or privacy policies of these sites, and shall not be responsible or liable for any information, opinions, advice, products or services available on or through them. Neither the Securities and Exchange Commission (SEC) nor any other federal or state agency have approved, determined the accuracy, or confirmed the adequacy of this article. LSR-23-508
About the Author: Larry Swedroe
—
Important Disclosures
For informational and educational purposes only and should not be construed as specific investment, accounting, legal, or tax advice. Certain information is deemed to be reliable, but its accuracy and completeness cannot be guaranteed. Third party information may become outdated or otherwise superseded without notice. Neither the Securities and Exchange Commission (SEC) nor any other federal or state agency has approved, determined the accuracy, or confirmed the adequacy of this article.
The views and opinions expressed herein are those of the author and do not necessarily reflect the views of Alpha Architect, its affiliates or its employees. Our full disclosures are available here. Definitions of common statistics used in our analysis are available here (towards the bottom).
Join thousands of other readers and subscribe to our blog.