The correlation between stocks and bonds should be a critical component of any asset allocation decision, as it impacts not only the overall risk of a diversified multi-asset class portfolio but also the risk premia one should expect to receive for taking risk in different asset classes. The problem for investors is that the correlation between stocks and bonds fluctuates extensively across time and economic regimes.
The year 2022 was particularly difficult for many investors because it was the first time both the S&P 500 Index (-18.1%) and long-term (20-year maturity) Treasury bonds (-26.1%) experienced double-digit declines. It was only the third year (2009 and 2013 were the other two) when long-term Treasury securities produced double-digit losses. And in both those cases, the S&P produced spectacular returns (26.5% in 2009 and 32.4% in 2013). The closest we had come to both producing double-digit losses was in 1969 when the S&P 500 lost 8.5% and long-term Treasury bonds lost 5.1%.
The double-digit declines in 2022 for both the S&P 500 and long-term Treasuries resulted in a 20.3% loss for a traditional 60/40 portfolio, the second-worst loss ever. The worst occurred in 1937 when the S&P 500 lost 35% and long-term Treasury bonds gained just 0.2%, resulting in a portfolio return of -21%.
The fact that both stocks and safe bonds produced large losses was a surprise to investors who, influenced by recency bias, believed that safe bonds were a sure hedge against risky stocks. The data over January 2000-December 2021 provided the rationale, as the monthly correlation between the two was -0.28. That led them to believe in what came to be referred to as the “Fed put” (if stocks fell sharply, the Fed would rescue them by lowering interest rates). Unfortunately for investors who do not know their history, correlations are not constant; they are time-varying/economic-regime dependent. For example, over the period 1926-1999, the correlation was, in fact positive, at 0.18.
A positive correlation means that when one asset tends to produce better-than-average returns, the other also tends to do so. And when it produces worse-than-average returns, the other tends to do so at the same time. With stocks and bonds, time-varying correlation is logical. For example, if we are in an economic regime when inflation is rising from very low levels (such as when coming out of a deflationary recession), stocks will tend to do well as economic activity is picking up, boosting demand, while bonds will tend to perform poorly as rates rise. However, when inflation begins to increase at levels that begin to concern investors (as it did in 2022), stocks can perform poorly at the same time bonds do (1969 was such a year, as the Consumer Price Index rose above 6%).
Looking at the historical data, before 2022 there had been five years when both the S&P 500 Index and long-term Treasury bonds produced negative returns (1931, 1969, 1973, 1977, and 2018). There had also been 21 years when the S&P 500 produced positive returns, and long-term bonds produced negative returns. And finally, there were 18 years when the S&P 500 produced negative returns, and long-term bonds produced positive returns.
Historical Evidence on the Stock-Bond Correlation
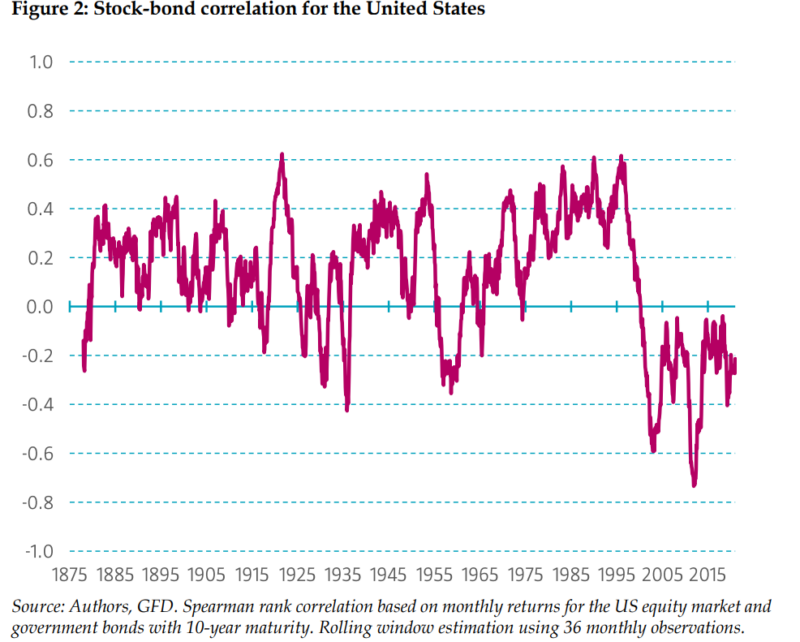
Roderick Molenaar, Edouard Senechal, Laurens Swinkels, and Zhenping Wang, authors of the July 2023 study “Empirical Evidence on the Stock-Bond Correlation,” analyzed the implications of a shift in a stock-bond correlation regime for the risk of multi-asset class portfolios and for bond risk premia. In addition to examining inflation and the real return on Treasury bills, they analyzed other explanatory variables that have been proposed in the literature: inflation volatility, equity volatility, bond volatility, the returns of a (hypothetical) 10-year zero-coupon bond, industrial production (the average annualized growth rate of industrial production), industrial production volatility (the volatility of monthly growth rates in industrial production), expected inflation (survey of inflation expectations over the next year), real T-bill yield (nominal yield of the T-bill minus expected inflation), and dispersion in expected inflation. Their U.S. data went back to 1875. In tests of robustness, they also examined data for two other countries for which they had more than 100 years of data: the U.K. (back to 1801) and France (back to 1871). As further tests, they examined data over the more modern period 1988-2022 for Canada, France, Germany, Italy, Japan, and the U.K. Here is a summary of their key findings:
- The stock-bond correlation can move considerably over time, which can greatly impact portfolio construction. For example, the average correlation between stocks and bonds was 0.35 in the U.S. between 1970 and 1999, and -0.31 between 2000 and 2022.
- The positive correlation between 1970 and 1999 led to portfolio volatility of 10.4% per annum for the 60/40 portfolio. However, the negative correlation from 2000-2022 led to a reduction in portfolio volatility to 8.5%. This decline could be partially attributed to a decline in bond volatility (from 8.2% to 7.2%) and a switching of the correlation sign. The result was that a 60/40 portfolio looked substantially less risky than it did historically.
- Before the 1950s, realized real returns on short-term bonds and inflation had no discernable impact on the stock-bond correlation. Since the 1950s, with the introduction of contracyclical monetary policies, there have been remarkably similar patterns across developed markets: The stock-bond correlation tends to be high when inflation and real returns on short-term bonds (and the uncertainty surrounding them) are high.
- In low-inflation environments, an increase in inflation has a small negative impact on the pricing of bonds. Still, it is good news for equity markets because it signals higher growth and lower equity risk premia. However, in high-inflation environments, the correlation between stocks and bonds is always positive. When inflation is low, it is the conjunction of low inflation and loose monetary policy that creates a negative correlation between stocks and bonds.
- Inflation, the real returns on short-term bonds, and the uncertainty surrounding inflation are the important factors for understanding the sign and magnitude of the stock-bond correlation. There was a highly statistically significant and strong positive relation between the stock-bond correlation and inflation and the real return on Treasury bills for the last subsample starting in 1952 (t-statistic of more than 5).
- A higher variance of real interest rates should generate larger co-movements in bonds and equity prices.
- Bond risk premia is positively correlated with estimates of the stock-bond correlation—bonds become riskier when the stock-bond correlation increases.
- Their findings were robust across countries.
Their findings led the authors to conclude:
“During the negative stock-bond correlation regime, 11.2%, more than 100% of the variance of a multi-asset portfolio can be ascribed to equities, as bond investments reduce overall portfolio variance. During the positive stock-bond correlation regime, the contribution of bond investments to total portfolio risk is positive as its returns no longer move opposite from the more volatile equity returns. This time-varying equity market hedging property of bonds may affect the expected risk premiums that can be earned on this market.” They added: “Meaningful long-term regime shifts in the stock bond correlation are important for the bond premium.”
Investor Takeaways
The evidence demonstrates that the stock-bond correlation experiences significant variation across economic regimes. During episodes of increased risk aversion (such as in 2000, 2008, and 2020), bond risk premia compress while equity risk premia expand. Such a relation depends on bonds being considered as “safe haven” assets. However, the assumption that sovereign bonds are always safe haven assets is not correct.
The lessons for investors include avoiding recency bias, knowing your investment history, and considering diversifying your portfolio to include assets whose risks have little to no correlation with the risks of stocks and bonds—such as reinsurance, long-short factor strategies, trend following, and senior, secured, sponsored, floating-rate private credit.
Larry Swedroe is head of financial and economic research for Buckingham Wealth Partners.
The opinions expressed here are their own and may not accurately reflect those of Buckingham Wealth Partners, collectively Buckingham Strategic Wealth, LLC and Buckingham Strategic Partners, LLC. For informational and educational purposes only and should not be construed as specific investment, accounting, legal, or tax advice. Neither the Securities and Exchange Commission (SEC) nor any other federal or state agency have approved, determined the accuracy, or confirmed adequacy of this article. The information provided may be based on third party data and may become outdated or otherwise superseded without notice. Third party information is deemed to be reliable, but its accuracy and completeness cannot be guaranteed. By clicking on any of the links above, you acknowledge that they are solely for your convenience, and do not necessarily imply any affiliations, sponsorships, endorsements, or representations whatsoever by us regarding third-party websites. We are not responsible for the content, availability, or privacy policies of these sites and shall not be responsible or liable for any information, opinions, advice, products, or services available on or through them. Indices are not available for direct investment. Their performance does not reflect the expenses associated with the management of an actual portfolio nor do indices represent results of actual trading. Information from sources deemed reliable, but its accuracy cannot be guaranteed. Performance is historical and does not guarantee future results. All investments involve risk, including loss of principal. LSR-23-544
About the Author: Larry Swedroe
—
Important Disclosures
For informational and educational purposes only and should not be construed as specific investment, accounting, legal, or tax advice. Certain information is deemed to be reliable, but its accuracy and completeness cannot be guaranteed. Third party information may become outdated or otherwise superseded without notice. Neither the Securities and Exchange Commission (SEC) nor any other federal or state agency has approved, determined the accuracy, or confirmed the adequacy of this article.
The views and opinions expressed herein are those of the author and do not necessarily reflect the views of Alpha Architect, its affiliates or its employees. Our full disclosures are available here. Definitions of common statistics used in our analysis are available here (towards the bottom).
Join thousands of other readers and subscribe to our blog.