The increasing role of intangible assets compared to physical assets in our economy has been accompanied by increased research into their impact on asset prices and returns. Studies such as the 2020 papers “Explaining the Recent Failure of Value Investing,” “Intangible Capital and the Value Factor: Has Your Value Definition Just Expired?,” and “Equity Investing in the Age of Intangibles,” and the 2023 paper “Value of Internally Generated Intangible Capital” have found that the increasing importance of intangibles, at least for industries with high concentrations of them, is playing an essential role in the cross-section of returns.
Since the development of the CAPM, academic research has attempted to find models that increase the explanatory power of the cross-section of stock returns. We moved from the single-factor CAPM to the three-factor Fama-French model (adding size and value), to the Carhart four-factor model (adding momentum), to Lu Zhang’s q-factor model (beta, size, investment, profitability), to the Fama-French five-factor (adding value to the q-factor model) and six-factor models (adding back value and momentum to the q-factor model). There have also been versions that use different metrics for profitability and value, and Stambaugh and Yuan’s mispricing (anomaly)-based model. Regardless of the model used, an anomaly for all models is that the empirical evidence demonstrates that stocks with high research and development (R&D) expenses have delivered a premium.
The Role of R&D
Research on the role of R&D expenditures, including the 2004 study “Valuation and Return Dynamics of New Ventures” and the 2020 studies “Mispricing or Risk Premium? An Explanation of the R&D-to-Market Anomaly,” “The R&D Anomaly: Risk or Mispricing?,” and “Corporate R&D and Stock Returns: International Evidence” has found:
- There are economically significant increases in average returns to portfolios sorted on R&D expenditures.
- The R&D effect is not concentrated in either smaller or larger firms.
- The R&D anomaly cannot be explained by existing asset pricing models, including the relatively recent investment and profitability factors.
- R&D-intensive firms are associated with higher future operating performance, return volatility, and default likelihood—the R&D effect is closely related to risk-bearing. This conflicts with a mispricing (behavioral) story: Investors underappreciate the value of R&D, resulting in low prices and high future (realized) returns.
In their January 2023 study, “R&D, Expected Profitability, and Expected Returns,” Sunil Wahal and Amit Goyal found:
- Adjusting for industry, high R&D firms had positive loadings on a cash-based operating profitability factor and zero alphas.
- Current R&D expenditures did not forecast asset growth.
- Current R&D expenditures forecasted future firm-level profitability at least three, sometimes 10, years into the future, establishing the channel by which R&D should show up in asset prices—expectations of future profitability. The evidence that R&D forecasted future profitability was even stronger in large stocks.
- The original versions of the five-factor and q pricing models could not price for R&D expenditures, principally because their profitability factors did not account for accruals. However, cash-based operating profitability “cleans up the models and eviscerates pricing errors.”
- It was unnecessary to capitalize R&D to reflect intangible investment in book values so long as expected profitability was explicitly recognized as a determinant of expected returns.
Latest Research
Kevin Tseng contributes to the literature with his January 2022 study, “Learning from the Joneses: Technology Spillover, Innovation Externality, and Stock Returns,” in which he examined how learning about new technology through technology spillover impacts asset prices and returns. He began by noting:
“Technological innovation is a key driver of long-term economic growth, and technologically innovative firms constitute a large share of the stock market in the United States. One of the characteristics of innovation is the non-excludability that allows a firm to learn technologically related information from its peers. … Technology spillover enables firms to learn from peers’ successes or failures as they simultaneously face their own uncertainties about technology prospects. Theoretical models that explain learning about new technology suggest that technology spillover, in the presence of technical uncertainty, enables firms to implement new technology timelier, thereby making large-scale technology adoption possible. Both this timelier adoption of new technology and a higher likelihood of large-scale technology adoption make the risks associated with technological innovation more systematic. These theoretical models then, importantly, imply that learning about new technology through technology spillover should impact asset prices.”
Tseng added: “In theory, firms face uncertainty when deciding if and when to implement new technology, as technology spillover enables firms to learn from peers’ successes or failures. This learning provides firms with more precise information about the new technology, which they then use to determine when (and the scale to which) they should adopt this new, profit-generating technology.”
To test whether firms with higher spillover earn higher returns in the cross-section, Tseng constructed empirical measures of spillover based on the amount of technological information a firm receives from its peers—measuring technology spillover using the patent-technology-weighted sum of peer firms’ R&D stocks. He explained:
“These patent-technology weights, or technology relatedness, reflect the notion that a firm learns more from technologies produced by other firms with patent-technology patterns similar to its own.”
Tseng’s sample consisted of patents granted from 1976 to 2006 from the updated National Bureau of Economic Research site, data of patents granted from 2007 to 2009 from the authors of the 2012 study “Technological Innovation, Resource Allocation, and Growth,” and hand-collected patents granted from 2010 to 2014 from Google Patent and later manually matched with Compustat. He included NYSE, AMEX, and Nasdaq-listed securities, excluding firms in the financial and utilities sectors. To construct the technology spillover measure, he required that firms have at least one patent granted in the past five years. His sample spanned the period 1982-2014. Here is a summary of his key findings:
- On average, each firm had none-zero technology relatedness, with 17.6% of other firms in the sample. Among those pairs, the average relatedness was 0.18. Therefore, unconditionally, each firm received 3.2% (17.6% × 0.18) of the R&D effort made by a peer firm.
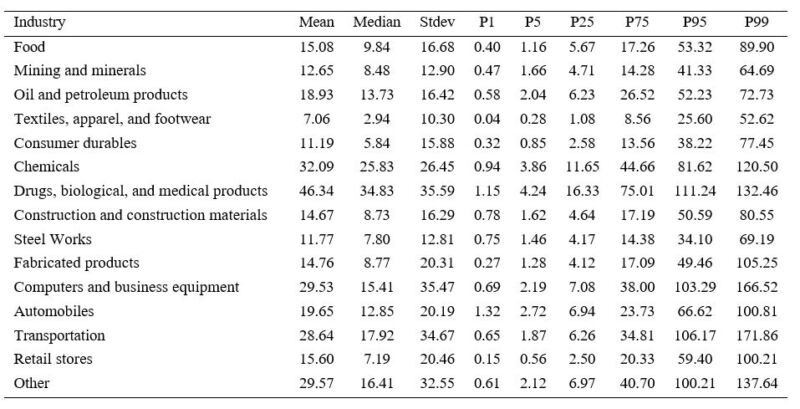
- The three industries with the highest (lowest) technology spillover are drugs and biomedical, chemicals, and computer industries (textile, steel, and mining industries). Their average technology spillovers were 46.34, 32.09, and 29.53 (7.06, 11.77, and 12.65) billion dollars per firm-year, respectively.
Technology Spillover of Industries
This table reports the pooled mean (Mean), median (Median), standard deviation (Stdev), 1st percentile (P1), 5th percentile (P5), 25th percentile (P25), 75th percentile (P75), 95th percentile (P95), and 99th percentile (P99) of the technology spillover measure for firms in industries based on the Fama-French 17 industry classification system. Financial and utility firms are excluded. Technology spillover (in billions of dollars) is computed by using the procedure described in Section 3.1 (based on the BSV approach). The sample period is 1982 to 2014.
The results are hypothetical results and are NOT an indicator of future results and do NOT represent returns that any investor actually attained. Indexes are unmanaged and do not reflect management or trading fees, and one cannot invest directly in an index.
- High technology spillover tended to be growth firms with more growth opportunities than assets in place, and firms with more growth opportunities were more likely to be affected by externalities from technological innovation.
- High technology spillover firms experienced lower idiosyncratic volatility, consistent with previous empirical findings that technology spillover reduces the uncertainty of existing projects.
- R&D capital was higher for firms with higher levels of technology spillover.
- Technology spillovers can induce complementarities in R&D efforts.
- Firms with higher levels of technology spillover were located in more competitive industries.
- There was a strong and positive relationship between technology spillover and future stock returns—portfolio returns increased with the level of technology spillover.
- The high technology spillover portfolio provided an annualized equal- (value-)weighted excess return of 14.28% (8.64%) with economically large and statistically significant alphas from factor models. For example, the q-factor monthly alpha of the equal- (value‑)weighted hedge portfolio was 0.64% (0.50%) with a t-statistic of 3.72 (3.93).
- Technology spillover enabled firms to adopt new technology to commercialize their innovations.
- Firms with higher levels of technology spillover had returns that were correlated more with systematic risk factors—they were riskier because they were more sensitive to macroeconomic conditions as measured by aggregate consumption growth.
- Low technology spillover firms were smaller, which is consistent with a finding in the technology spillover literature that smaller firms tend to operate within a technology niche.
- Increases in peer firms’ R&D tax credit stimulated peers’ R&D spending—they increased technology spillovers.
Providing robust support for his findings, Tseng found that legislation that decreased spillover effects (such as the staggered passage of the Uniform Trade Secrets Act and the staggered adoption of the Inevitable Disclosure Doctrine) lessened the spillover effect. In contrast, legislation (such as the Inventor Protection Act, which was found to accelerate patent disclosures by an average of 11 months) that increased the spillover effect strengthened it.
Tseng’s findings led him to conclude: “Firms with higher levels of technology spillover have higher stock returns in the cross-section. These results are robust to alternative measures of technology spillover and to controls of known return predictors.” He added:
“My findings support the implication that technology spillover enables firms to learn about and subsequently adopt new technology in the presence of technology-based uncertainty. The timelier adoption of new technology and the higher likelihood of large-scale technology adoption make the risk associated with technological innovation more systematic, which in turn increases returns required by investors for technology spillover recipients.”
Investor Takeways
Supported by the findings of a significant positive relationship between R&D expenditures and future stock returns and the risk-based explanations for the R&D effect, the empirical research suggests a fundamentally important role of intellectual capital, specifically R&D, in asset pricing—the higher returns to high R&D stocks represent compensation for heightened systematic risk not captured in standard asset pricing models.
Tseng contributed to the literature that explores financial market implications of intangibles, showing that technology spillover is an important externality of intangibles—excess returns accrue not only to firms with high R&D themselves but also to those whose peers engage in R&D. He also provided support for a risk-based explanation for the R&D premium: Innovation is risky.
Larry Swedroe is the author or co-author of 18 books on investing, including his latest Enrich Your Future.
For informational and educational purposes only and should not be construed as specific investment, accounting, legal, or tax advice. Neither the Securities and Exchange Commission (SEC) nor any other federal or state agency have approved, determined the accuracy, or confirmed adequacy of this article. Certain information may be based on third party data and may become outdated or otherwise superseded without notice. Third party information is deemed to be reliable, but its accuracy and completeness cannot be guaranteed. By clicking on any of the links above, you acknowledge that they are solely for your convenience, and do not necessarily imply any affiliations, sponsorships, endorsements or representations whatsoever by us regarding third-party websites. Buckingham is not responsible for the content, availability or privacy policies of these sites, and shall not be responsible or liable for any information, opinions, advice, products or services available on or through them. The opinions expressed here are their own and may not accurately reflect those of Buckingham Wealth Partners. LSR-23-559
About the Author: Larry Swedroe
—
Important Disclosures
For informational and educational purposes only and should not be construed as specific investment, accounting, legal, or tax advice. Certain information is deemed to be reliable, but its accuracy and completeness cannot be guaranteed. Third party information may become outdated or otherwise superseded without notice. Neither the Securities and Exchange Commission (SEC) nor any other federal or state agency has approved, determined the accuracy, or confirmed the adequacy of this article.
The views and opinions expressed herein are those of the author and do not necessarily reflect the views of Alpha Architect, its affiliates or its employees. Our full disclosures are available here. Definitions of common statistics used in our analysis are available here (towards the bottom).
Join thousands of other readers and subscribe to our blog.