As the head of financial and economic research at Buckingham Wealth Partners, I’ve been getting lots of questions about The Magnificent Seven—not the movie, one of the greatest westerns of all time starring Yul Brynner and Steve McQueen, but Apple (+35.2%), Amazon (+50.0%), Microsoft (+34.1%), Nvidia (+205.9%), Alphabet (+53.3%), Tesla (+111.1%), and Meta Platforms (+153.3%). Through October 5, 2023, these stocks had returned an average of almost 92%. Together they account for basically the entire 12.4% gain of the S&P 500 Index—an equal-weighted version of the S&P 500 would have returned just 0.1%. What, if any, implications does such a dramatic dispersion in returns have for investors?
While the performance of these stocks has been spectacular, it has led to the increased concentration of market-like portfolios, reducing the benefits of diversification and increasing a portfolio’s exposure to idiosyncratic risks. While market-cap-weighted indexes, by their nature, will have some concentration of risk in the largest stocks, thanks to the research team at Avantis, we can see that concentration levels for the 10 largest stocks in several common indices are now at historical highs. As Figure 1 below shows, while the concentration level for the S&P 500 Index was almost 31% at the end of August, it exceeded 51% for the Russell 1000 Large Growth Index. In contrast, the concentration level for the Russell 1000 Large Value Index was about 17% and about 15% for the MSCI EAFE Index. Concentration risk is dramatically lower in the small-cap indices: about 3% for the Russell 2000, about 6% for the Russell 2000 Growth, and less than 5% for the Russell 2000 Value.
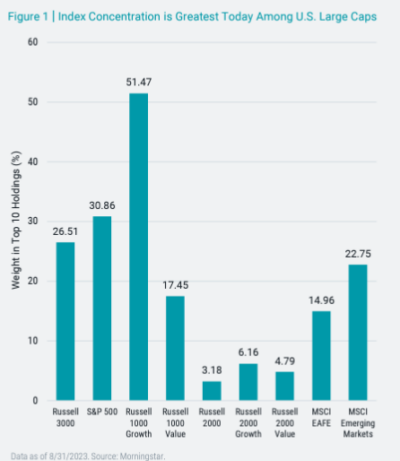
The results are hypothetical results and are NOT an indicator of future results and do NOT represent returns that any investor actually attained. Indexes are unmanaged and do not reflect management or trading fees, and one cannot invest directly in an index.
The following chart shows that concentration levels have increased dramatically in recent years, while the levels for the smaller cap and value indices have been relatively stable. Note also that they are now significantly higher for the Russell 1000 Growth and S&P 500 Indices than before the dot-com bubble bursting in March of 2000. On the other hand, the concentration levels for the Russell 2000 and the Russell 1000 Value indices are at or near their lowest levels.
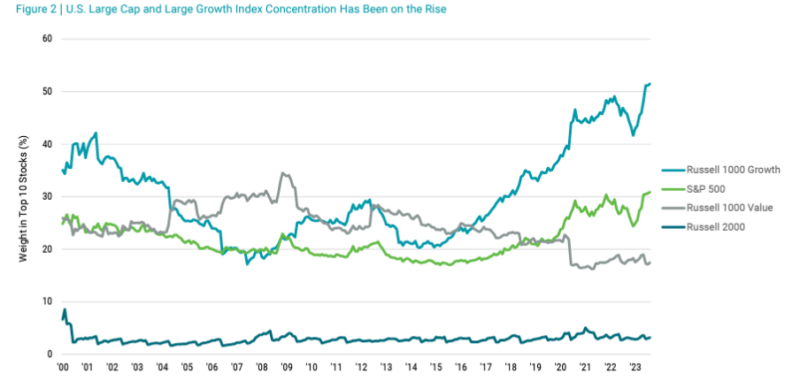
The results are hypothetical results and are NOT an indicator of future results and do NOT represent returns that any investor actually attained. Indexes are unmanaged and do not reflect management or trading fees, and one cannot invest directly in an index.
The next table shows the historical concentration levels for various indices, including their minimum, maximum, and average concentration levels.
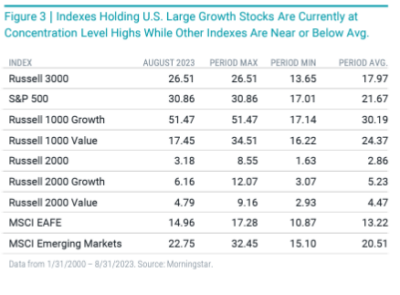
The results are hypothetical results and are NOT an indicator of future results and do NOT represent returns that any investor actually attained. Indexes are unmanaged and do not reflect management or trading fees, and one cannot invest directly in an index.
What, if any, are the takeaways for investors?
Investor Takeaways
The data shown shouldn’t cause you to believe that the market is a bad investment simply because a subset of large companies constitutes a large portion of the overall market. However, when a small subset of companies makes up a large portion of a portfolio, for better or worse their returns will have a greater impact on overall portfolio results. Thus, the increased concentration of market cap and growth indices has led to increased portfolio risk. Investors should also be concerned that the increased concentration has been created by the dramatic rise in the valuations of the Magnificent Seven, which increased by far more than their earnings. The historical evidence clarifies that higher valuations typically lead to lower future returns.
Consider that as of October 6, 2023, while the iShares Russell 1000 Growth ETF (IWF) had a P/E of 24.2 and Vanguard’s S&P 500 ETF (VOO) had a P/E of 20, the P/E of the Vanguard Russell 1000 Value ETF (VONV) was 15, the P/E of the Vanguard Russell 2000 ETF (VTWO) was 13.3, and the P/E of the Vanguard Russell 2000 Value ETF (VTWV) was just 10.5. Now consider the P/Es of the magnificent seven: Apple, 29.8; Amazon, 100.7; Microsoft, 33.8; Nvidia, 110.5; Alphabet, 29.4; Tesla, 73.8; and Meta Platforms, 36.8. That’s an average P/E of 59.3.
History’s Lessons
One of my favorite expressions is that what you don’t know about investing is the investment history you don’t know. With that in mind, let’s review the list of the 10 largest stocks by market cap in the S&P 500 Index at the turn of the century. They were Microsoft, Cisco Systems, Exxon Mobil, Intel, Citigroup, IBM, General Electric, Oracle, and Home Depot. From January 2000 through September 2023, Vanguard’s 500 Index Fund (VFINX) returned 6.5% per annum. How did the top 10 perform?
- Microsoft: 9.5%
- Cisco Systems: 1.6%
- Exxon Mobil: 7.9%
- Intel:1.7%
- Citigroup: -7.1%
- IBM: 3.8%
- General Electric: -1.8%
- Oracle: 6.6%
- Home Depot: 8.6%
- AT&T: 1.4%
The average return to the 10 largest stocks in the S&P 500 Index from January 2000 through September 2023 was just 3.2%, underperforming the index itself by 3.3 percentage points. Because these were the largest stocks, the underperformance relative to the remaining 490 stocks was even worse. Investors in the top 10 stocks took a much greater degree of idiosyncratic risk and earned lower returns. Forewarned is forearmed.
Done properly, diversification of risk is an investor’s friend, reducing the volatility of a portfolio without reducing its risk-adjusted expected returns. On the other hand, concentrated portfolios increase the potential dispersion of outcomes without increasing expected returns. Thus, all else equal, less-concentrated portfolios should be preferred. One way for investors to diversify the risk of concentration, as well as high valuations, is to move their allocations more toward value strategies, which over the long term have produced above-market returns.
Larry Swedroe is the author or co-author of 18 books on investing, including his latest Enrich Your Future.
For informational and educational purposes only and should not be construed as specific investment, accounting, legal, or tax advice. Neither the Securities and Exchange Commission (SEC) nor any other federal or state agency have approved, determined the accuracy, or confirmed adequacy of this article. Mentions of specific securities should not be construed as specific recommendations of securities highlighted. Indices are not available for direct investment. Their performance does not reflect the expenses associated with the management of an actual portfolio nor do indices represent results of actual trading. Information from sources deemed reliable, but its accuracy cannot be guaranteed. Performance is historical and does not guarantee future results. All investments involve risk, including loss of principal. By clicking on any of the links above, you acknowledge that they are solely for your convenience, and do not necessarily imply any affiliations, sponsorships, endorsements or representations whatsoever by us regarding third-party websites. Buckingham is not responsible for the content, availability or privacy policies of these sites, and shall not be responsible or liable for any information, opinions, advice, products or services available on or through them. The opinions expressed here are their own and may not accurately reflect those of Buckingham Strategic Wealth or its affiliates. LSR-23-570
About the Author: Larry Swedroe
—
Important Disclosures
For informational and educational purposes only and should not be construed as specific investment, accounting, legal, or tax advice. Certain information is deemed to be reliable, but its accuracy and completeness cannot be guaranteed. Third party information may become outdated or otherwise superseded without notice. Neither the Securities and Exchange Commission (SEC) nor any other federal or state agency has approved, determined the accuracy, or confirmed the adequacy of this article.
The views and opinions expressed herein are those of the author and do not necessarily reflect the views of Alpha Architect, its affiliates or its employees. Our full disclosures are available here. Definitions of common statistics used in our analysis are available here (towards the bottom).
Join thousands of other readers and subscribe to our blog.