The timing of equity factor premiums has a strong allure for investors because academic research has found that factor premiums are both time-varying and dependent on the economic cycle. For example, Arnav Sheth and Tee Lim, authors of the December 2017 study “Fama-French Factors and Business Cycles,” examined the behavior of six Fama-French factors—market beta (MKT), size (SMB), value (HML), momentum (MOM), investment (CMA), and profitability (RMW)—across business cycles, splitting them into four separate stages: recession, early stage recovery, late stage recovery, and very late stage recovery. Their data, including the results shown in the following table, covered the period from April 1953 through September 2015.
Cumulative Returns for 6 Factors Across Economic Stages (%)
| Recession | Early | Late | Very Late | |
| SMB | -1.5 | 9.0 | 4.8 | 1.7 |
| HML | 12.5 | 17.1 | 9.8 | 2.2 |
| MKT | -6.9 | 29.0 | 32.2 | 29.7 |
| MOM | 11.2 | 17.9 | 13.7 | 13.7 |
| RMW | 1.9 | 6.7 | 5.5 | 7.0 |
| CMA | 18.3 | 13.5 | 3.5 | 1.2 |
As you can see, factor premiums vary and are regime-dependent. That, of course, makes timing them tempting. Is factor timing a good strategy, or is it one that can be said to be “fraught with opportunity”?
Empirical Evidence
Dimensional’s Wei Dai and Audrey Dong, authors of the October 2023 study “Another Look at Timing the Equity Premiums,” examined 720 timing strategies that time the market, size, value, momentum, and profitability premiums in the U.S., developed ex-U.S., and emerging markets based on three common timing approaches: valuation ratio, mean reversion and momentum. Each premium was defined as the return difference between the long side and the short side of the premium: market versus Treasury bills, small caps versus large caps, value versus growth, and high versus low profitability. The sample period for U.S. premiums started in July 1927 except for profitability, which started in July 1963. The developed ex-U.S. sample started in July 1990, and the emerging markets sample started in July 1994. All data were monthly through December 2022.
The timing strategies switched between the long and short sides of each premium in an attempt to outperform strategies that stayed invested in the long side of the premium. At each rebalancing time, the strategies chose between the long and short sides by comparing the current timing signal with its historical distribution. When the current valuation spread was relatively high (the long side was relatively expensive), the strategies switched to the short side. When the spread was relatively low (the long side was relatively cheap), the strategies switched back to the long side. For mean reversion, the premise was that high realized premiums tend to be followed by low future premiums and vice versa. Thus, when the realized premium was relatively high, the strategies switched to the short side of the premium. When the realized premium became relatively low, the strategies switched back to the long side. For momentum, the premise was that premiums with strong past performance are likely to continue their outperformance in the near future—the opposite of mean reversion. Thus, the strategies would switch to the short side of the premium when the past one-year premium was relatively low and switch back to the long side when the past one-year premium became relatively high.
Dai and Dong noted that while conceptually these strategies are straightforward, the large degree of freedom given the multiple parameters—including the measurement window for calculating the historical distribution of the timing signal, when to switch to the short side of the premium (breakpoint), when to switch back to the long side (switchback), and the rebalancing frequency) – resulted in 720 timing strategies (3 timing approaches × 3 regions × 4 premiums × 2 measurement windows × 5 breakpoint and switchback pairs × 2 rebalancing frequencies). This creates the risk of data mining, otherwise known as ‘torturing the data until it confesses’.
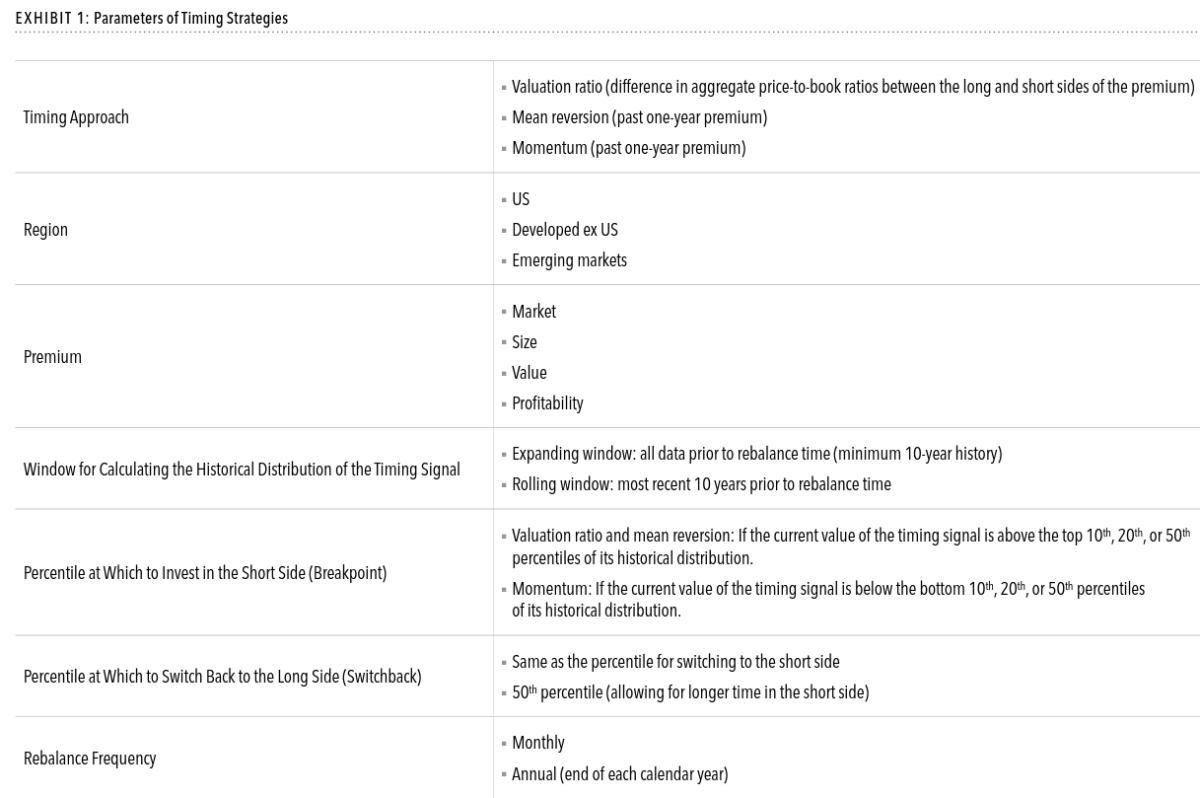
Exhibit 2 from the paper shows
“a monthly rebalanced strategy that times the US market premium using the aggregate price-to-book ratio of the market with a breakpoint at the top 10th percentile and a switchback at the 50th percentile of its historical distribution calculated with an expanding window (all data prior to rebalance time with a minimum of 10 years). The sample period is July 1927 to December 2022. Since the calculation of the historical distribution of price-to-book ratios requires at least 10 years of historical data, the first trading day starts in June 1937.”
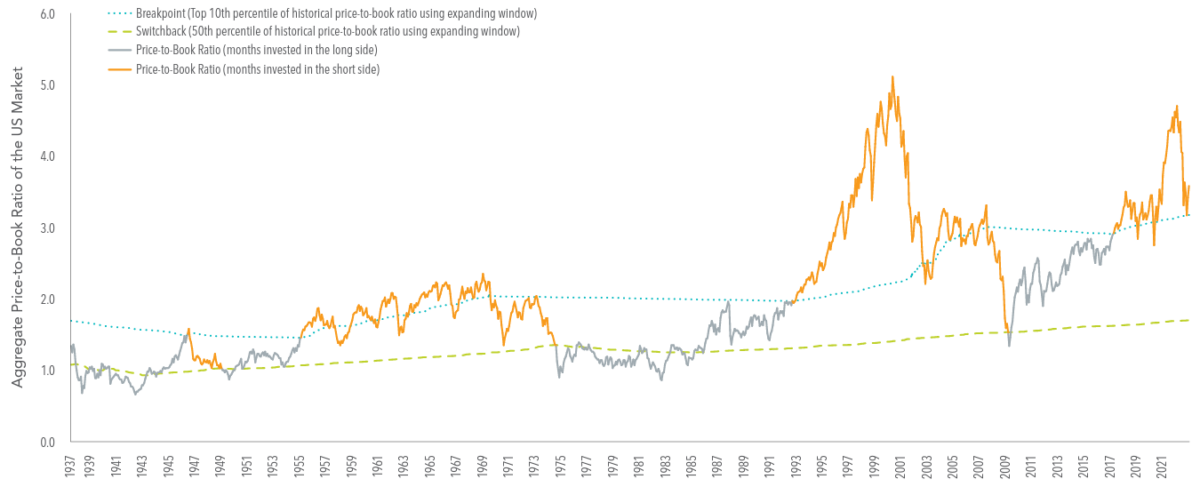
The results are hypothetical results and are NOT an indicator of future results and do NOT represent returns that any investor actually attained. Indexes are unmanaged and do not reflect management or trading fees, and one cannot invest directly in an index.
As you review their key findings, keep in mind the criteria Andrew Berkin and I established in our 2016 book, Your Complete Guide to Factor-Based Investing, that should be required to consider a factor strategy reliable: It must have delivered a premium that was persistent across time, pervasive across markets, robust to various definitions, survive transactions costs, and have logical reasons (risk- or behavioral-based, with a preference for risk-based because risk cannot be arbitraged away) to believe the premiums will persist in the future.
Following is a summary of their key findings:
- Out of the 720 timing strategies simulated, the vast majority underperformed relative to staying invested in the long side of the premiums.
- The strategies generated an average excess return of -1.1% per year—and that’s before implementation costs and ignores taxes.
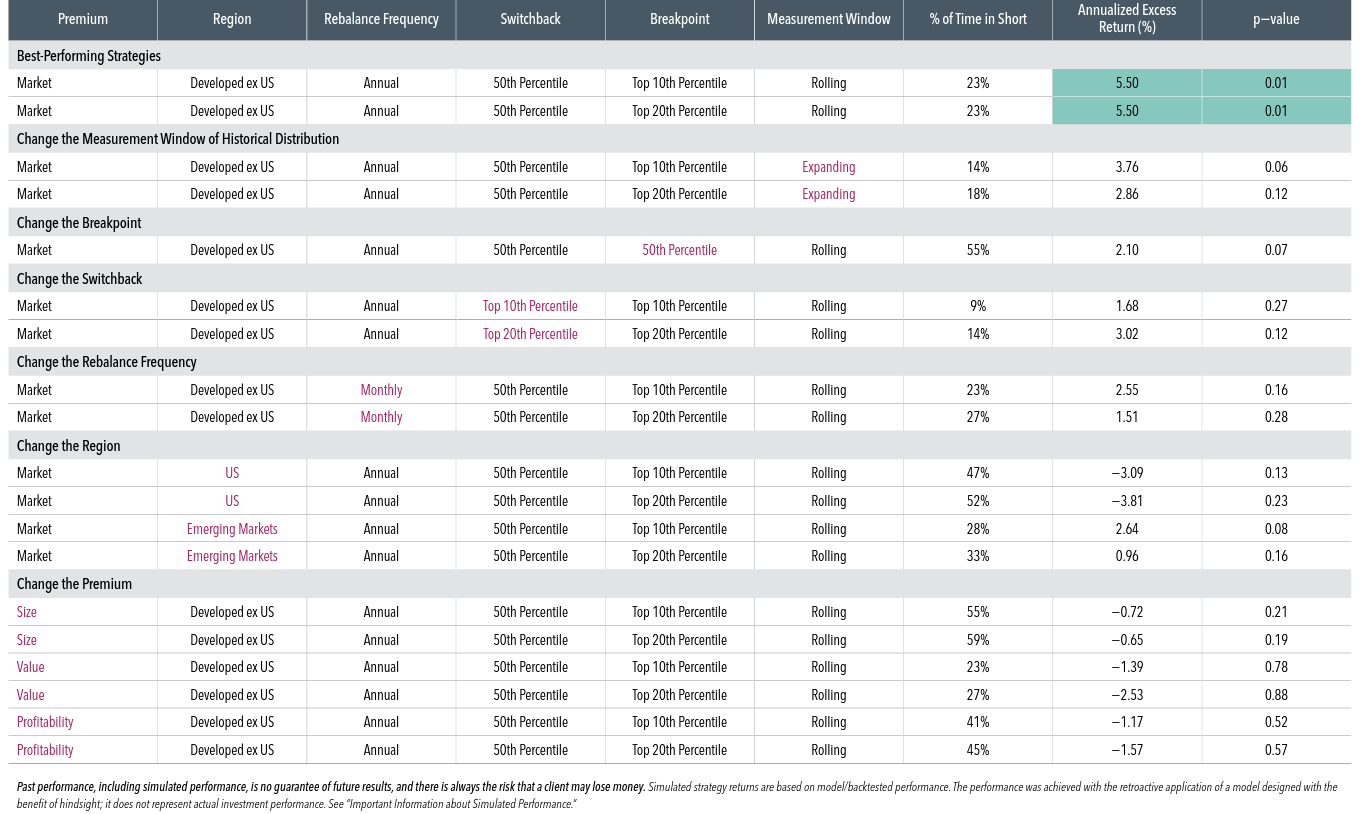
- While 30 strategies (4.2% of the sample) delivered promising outperformance at first glance, their outperformance was very sensitive to specific time periods and parameters for strategy construction.
- Two strategies generated excess returns of 5.5% per year timing the market premium in the developed ex-U.S. markets based on the aggregate valuation ratio and were able to avoid major market downturns in 2001, 2008, and 2022. While these results might look promising, we should randomly expect some combination of parameters to generate excellent results just by chance due to the large number of timing strategies examined. To minimize the risk of a random outcome, a strategy should show evidence of pervasiveness. This was not the case, as these two strategies did not generate significant results in the U.S. or emerging markets. In addition, to be considered reliable, a strategy should be robust to various definitions. However, changing one single parameter of the strategies, such as the breakpoint or the rebalance frequency, reduced the excess return by more than half and made it no longer reliable.
- All 20 momentum strategies that timed the U.S. size premium produced reliably positive excess returns, resulting in an average excess return of 0.75% per year. The authors issued this caveat: “A closer inspection, however, reveals that a meaningful portion of this outperformance is driven by a couple of periods—when a year with a very negative size premium is followed by another bad year. For example, the size premium was ‑13.65% in 1972 followed by -20.64% in 1973, which means that most of the momentum strategies would have invested in large caps in 1973. That decision contributes almost half of the average annualized excess return (0.33% out of 0.75%). As a result, if we run the analysis over the second half of the sample period (1975-2022), none of the strategies deliver reliably positive excess returns.” To be considered reliable, a strategy should be persistent across time.
The results are hypothetical results and are NOT an indicator of future results and do NOT represent returns that any investor actually attained. Indexes are unmanaged and do not reflect management or trading fees, and one cannot invest directly in an index.
EXHIBIT 4: Sensitivity Analysis. This table includes the parameters, percentage of time investing in the short side of the premium, annualized excess returns, and p-values for the two best-performing timing strategies as well as 17 other timing strategies, each of which changes one single parameter (in red) of the best-performing strategies. These strategies use the valuation ratio approach to time the premiums. The description of the parameters can be found in the Construction of Timing Strategies section in the paper. Annualized excess return is calculated as the annualized return difference between the premium timing strategy and staying invested in the long side of the premium. P-value is calculated using the bootstrap method. Excess returns that are reliably positive (p-value less than 0.05) are highlighted in teal.
Their findings led Dai and Dong to conclude:
“Our results highlight the opportunity cost of mistiming the premiums and the importance of discipline for capturing the premiums.” They added: “Rather than trying to predict the unpredictable, investors can be better served integrating multiple premiums and staying disciplined to reap the potential long-term rewards in the ever-changing market.”
Dai and Wong’s findings are consistent with those of prior researchers.
Supporting Evidence
In their study “Contrarian Factor Timing Is Deceptively Difficult,” which appeared in the 2017 special issue of The Journal of Portfolio Management, Cliff Asness, Swati Chandra, Antti Ilmanen, and Ronen Israel found “lackluster results” when they investigated the impact of value timing—whether dynamic allocations can improve the performance of a diversified multi-style portfolio. They found that “strategic diversification turns out to be a tough benchmark to beat.” They added: “Tactical value timing can reduce diversification and detract from the performance of a multi-style strategy that already includes value.” They also found that contrarian value timing of factors, while tempting, is generally a weak addition for long-term investors holding well-diversified factors including value, and specifically, it does not send a strong signal even when valuations are stretched.
Providing further evidence of the difficulty of timing factor premiums is the August 2018 study “Factor Exposure Variation and Mutual Fund Performance.” Authors Manuel Ammann, Sebastian Fischer, and Florian Weigert examined whether actively managed mutual funds were successful at timing factor premiums (net of fees) over the period late 2000 through 2016. They found that while factor timing activity was persistent, risk factor timing was associated with future fund underperformance. For example, a portfolio of the 20% of funds with the highest timing indicator underperformed a portfolio of the 20% of funds with the lowest timing indicator by a risk-adjusted 134 basis points per year with statistical significance at the 1% confidence level (t-stat: 3.3). Summarizing their results, Ammann, Fischer, and Weigert concluded:
“Our results do not support the hypothesis that deviations in risk factor exposures are a signal of skill and we recommend that investors should resist the temptation to invest in funds that intentionally or coincidentally vary their exposure to risk factors over time.”
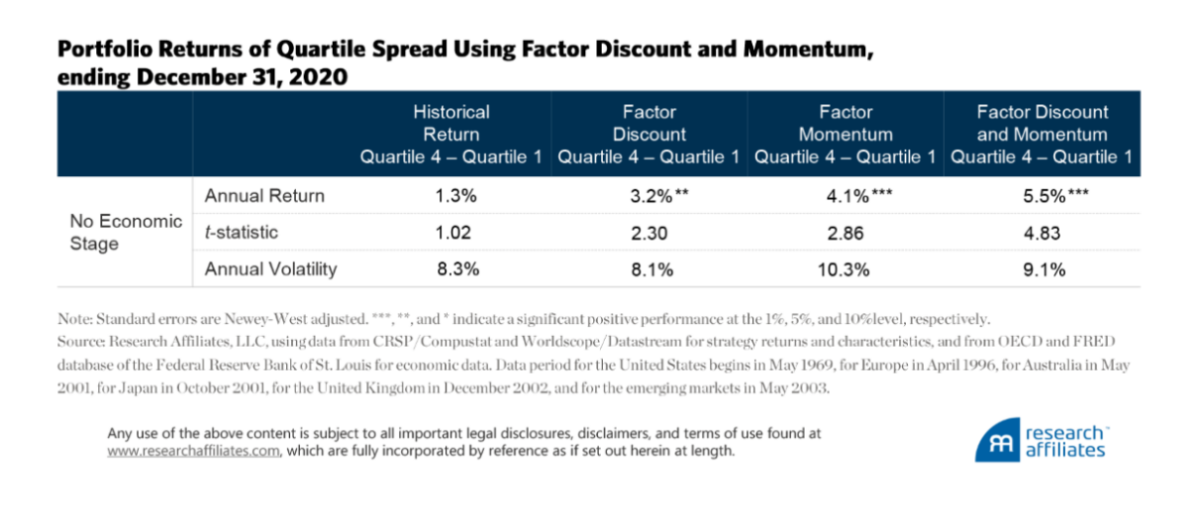
Michael Aked of Research Affiliates took another look at the issue in his April 2021 study, “Factor Timing: Keep It Simple.” He evaluated three factor-timing strategies—a factor’s historical return, the economic stage, and a factor’s discount and momentum—using only data that was available at the time. A factor portfolio’s discount was calculated as its current valuation (using the relationship of price to various fundamental measures of the component equities) relative to its average historical valuation. A factor’s momentum was the performance of the factor over the previous 12 months.
In each case, the strategy was constructed out-of-sample using data only available at the time of the specific sample period. He examined eight factors: market, value, investment, size, illiquidity, profitability, low beta, and momentum) across six regions (Australia, the United States, Europe, the United Kingdom, Japan, and the emerging markets). Data for the U.S. began in May 1969, for Europe in April 1996, for Australia in May 2001, for Japan in October 2001, for the U.K. in December 2001, and for emerging markets in May 2003. His findings led him to conclude:
- The strategy of using a factor’s historical performance as a guide to the future was nearly worthless.
- Although a factor’s return changes throughout the business cycle, the ability to predict economic regimes and alter factor allocations accordingly produced less successful results despite being intuitively pleasing.
- Employing a factor’s discount and momentum was the most effective tool for determining how to vary a factor’s exposure through time.
The results are hypothetical results and are NOT an indicator of future results and do NOT represent returns that any investor actually attained. Indexes are unmanaged and do not reflect management or trading fees, and one cannot invest directly in an index.
The finding that timing based on the state of the economy does not produce successful results is unsurprising, as the markets are forward-looking. Thus, whatever is known about the economy is already incorporated into security prices. The finding that factor discounts and momentum are the most effective tools also should not be a surprise because this has been well documented in the literature. For example, the authors of the 2019 paper “Factor Momentum Everywhere,” the 2020 paper “Factor Momentum and the Momentum Factor,” and the 2023 paper “Momentum? What Momentum?” found that momentum in individual stock returns emanates from momentum in factor returns—a factor’s prior returns inform its future returns. The authors of the November 2019 study “Value Return Predictability Across Asset Classes and Commonalities in Risk Premia” also found that valuation spreads provide information on future returns.
They explained:
“Returns to value strategies in individual equities, industries, commodities, currencies, global government bonds, and global stock indexes are predictable in the time series by their respective value spreads.”
Further evidence on valuation spreads was provided by Thiago de Oliveira Souza, author of the May 2020 study “Macro-Finance and Factor Timing: Time-Varying Factor Risk and Price of Risk Premiums.” He found that increases in the cross-sectional book-to-market spreads significantly forecast increases in one-month-ahead premiums for all except the profitability factor. Souza’s findings were consistent with those of Adam Zaremba and Mehmet Umutlu, authors of the March 2019 study “Strategies Can Be Expensive Too! The Value Spread and Asset Allocation in Global Equity Markets,” who found that the value spread is a powerful and robust predictor of strategy returns. Aked did not cite any of these papers.
For value investors, the above findings are particularly good news, as the relatively poor performance of value stocks in the U.S. over the past decade has led to a dramatic widening of the book-to-market spread between value and growth stocks; the spread is now much wider than its historical average and much wider than it was when Eugene Fama and Kenneth French published their famous study “The Cross-Section of Expected Stock Returns” in 1992 (they found a large value premium).
Takeaways
The evidence suggests that if you try to time your exposure to factors, you should be very cautious and, to quote AQR’s Cliff Asness, only “sin a little” because the data is so “noisy”—factor volatility is much greater than factor premium.
While the empirical findings may be disappointing to those investors who are looking for the best time to invest in factor premiums, the takeaway is that the very volatility of premiums should lend confidence that the expected premiums are positive in the first place—the more difficult it is for investors to stay the course during periods of underperformance, the more likely the strategy (premium) will persist. The result is that the willingness to bear uncertainty risk, tracking error risk, and potential underperformance should be rewarded with higher expected (not guaranteed) returns.
Rather than trying to predict the unpredictable, investors are best served by diversifying risks across multiple unique factors/premiums that meet all the criteria discussed above and staying disciplined. For those interested in learning more about how diversification across unique risks can create more efficient portfolios while reducing tail risks, I recommend reading the 2018 edition of Reducing the Risk of Black Swans.
Larry Swedroe is the author or co-author of 18 books on investing, including his latest Enrich Your Future.
For informational and educational purposes only and should not be construed as specific investment, accounting, legal, or tax advice. Certain information is based on third party data and may become outdated or otherwise superseded without notice. Third party information is deemed to be reliable, but its accuracy and completeness cannot be guaranteed. Investing involves risk. Past performance does not guarantee future results. Neither the Securities and Exchange Commission (SEC) nor any other federal or state agency have approved, determined the accuracy, or confirmed the adequacy of this presentation. LSR-23-583
About the Author: Larry Swedroe
—
Important Disclosures
For informational and educational purposes only and should not be construed as specific investment, accounting, legal, or tax advice. Certain information is deemed to be reliable, but its accuracy and completeness cannot be guaranteed. Third party information may become outdated or otherwise superseded without notice. Neither the Securities and Exchange Commission (SEC) nor any other federal or state agency has approved, determined the accuracy, or confirmed the adequacy of this article.
The views and opinions expressed herein are those of the author and do not necessarily reflect the views of Alpha Architect, its affiliates or its employees. Our full disclosures are available here. Definitions of common statistics used in our analysis are available here (towards the bottom).
Join thousands of other readers and subscribe to our blog.