Short-term return anomalies are generally dismissed in the academic literature “because they seemingly do not survive after accounting for market frictions.” In this research, short-term “factors” are taken seriously, and the authors argue the standard parameters may not apply to short horizons. The authors ask: Do the standard assumptions regarding estimates for trading costs, illiquidity, and rebalance horizons accurately measure the real-world opportunity for short-term anomalies? The authors make some compelling arguments that they are insufficient and rebalance schedule and the costs of trading can make all the difference when the signal is short-term.
Beyond Fama-French Factors: Alpha from Short-Term Signals
- David Blitz, Matthias X. Hanauer, Iman Honarvar, Rob Huisman, Pim van Vliet
- Journal of Financial Economics, forthcoming
- A version of this paper can be found here
- Want to read our summaries of academic finance papers? Check out our Academic Research Insight category.
What are the research questions?
- Are there reasons to believe that research on short-term anomalies utilized inadequate design and poorly determined estimates of trading costs?
- Can an investment strategy constructed from short-term signals produce economically meaningful and statistically significant alpha?
What are the Academic Insights?
- YES. The authors discuss several issues associated with the typical FF methodology used to test short-horizon anomalies. First, due to illiquidity, the trading costs for small-cap stocks exceed those for larger-cap stocks. However, there is a mismatch between the representation of illiquid stocks (50%) in the FF methodology for constructing factors and their representation in the overall market (10%). That mismatch provides a potential opportunity for traders if realistic trading costs are used. Second, since the academic literature has established that “gross and net performance” is improved when uncorrelated short-term signals are combined, the authors argue the better test would be combining low correlation signals to gain the benefits of diversification. Stacking a single short-term signal against the FF risk model is an inefficient and unrealistic test. Third, most studies utilize trading strategies that construct portfolios using the top and bottom ntiles on a monthly basis. At least two studies (Novy-Marx and Velikov in 2016 and 2019) document more advanced buy/sell signals can reduce trading costs far over the loss in returns. In and of itself, the estimate of trading costs used in academic research is overly stringent. In reality, investors can trade with much lower costs than commonly assumed.
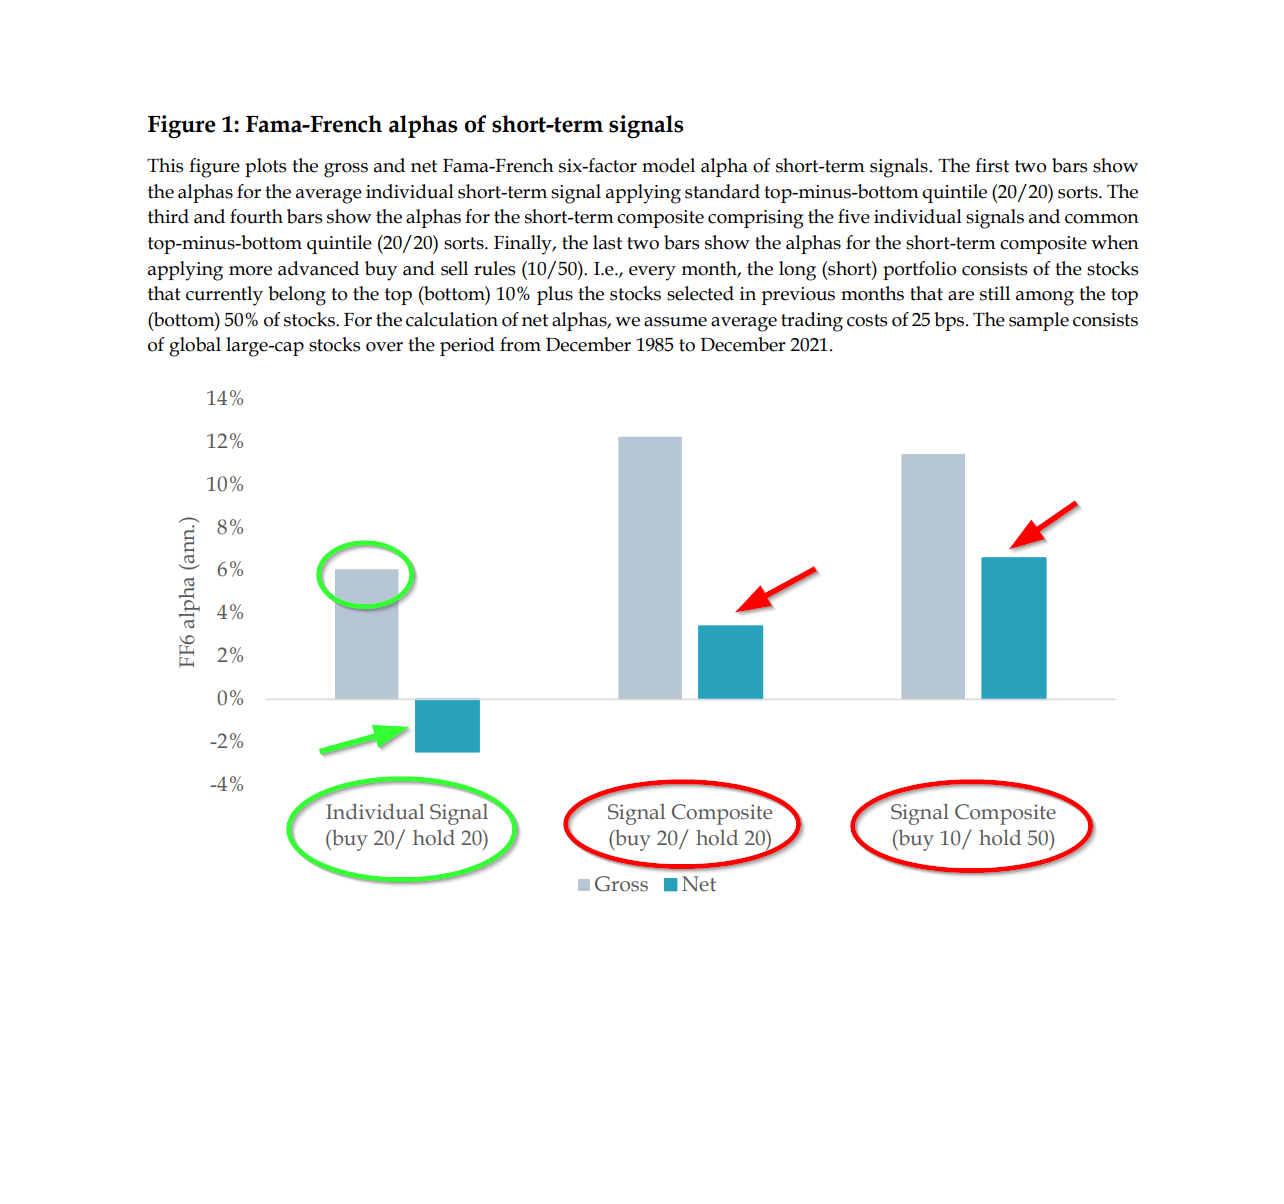
- YES. The results are summarized in Figure 1 below. Signals used to create long/short positions included industry relative reversal, industry momentum, revisions in analyst earnings forecasts, return seasonality and idiosyncratic volatility. The average alpha before costs of 6% on the left-hand side of the figure, was obtained using each of the signals individually and with respect to the FF six-factor risk model. That value dropped to -2% when high turnover costs were included at 25bps per trip. The results of using a composite signal increased the alpha to 12% and then dropped by 66% with transactions costs. Note that as the buy and sell rules were refined (buy 10/hold 50) the net alpha did increase above 6%, as turnover decreased. The authors caution that the break-even costs exceeded 55bps, when keeping the alpha significant, an amount even the most skilled investors and traders are unlikely to obtain. These results were robust to implementation in global markets, were not unduly driven by the short or long positions, and robust to implementation lags of 1 or 2 days as required by real-time conditions. One last analysis examined the out-of-sample and post-publication periods for the signals. Performance decays associated those periods were between 18% and 40%. However, excess returns to the strategies remained statistically and economically significant. This was one of the more exciting robustness tests conducted. The reader is referred to the results presented in Table 6 in the paper.
Why does it matter?
The primary focus of this work reflects the current consensus in the academic world and of most practitioners:
“High-turnover anomalies are generally dismissed in the asset pricing literature, primarily because of the concern that they may not survive after accounting for transaction costs.”
Nonetheless, the thoughtful analysis presented by the authors shines new light on the issue. It seems that it is premature to reject the idea that anomalous return performance from short-term signals is entirely explained by market frictions. It is safer and more accurate to conclude that the return performance documented in this research is a valuable opportunity to extract alpha even after accounting for common risk factors. It is logical to accept that common risk models describe the long-term (12 months or more) cross-sectional behavior and that short-run (less than 12 months) behavior is subject to other market dynamics. Those dynamics do not include risk-based or rational explanations and are most likely a function of behavioral biases. As such, the implications for investors are good. Focus on the short-term, uncorrelated alpha opportunities already documented and others that are undiscovered and consistent with behavioral explanations.
Note: Larry has a piece on this paper here.
The most important chart from the paper
The results are hypothetical results and are NOT an indicator of future results and do NOT represent returns that any investor actually attained. Indexes are unmanaged and do not reflect management or trading fees, and one cannot invest directly in an index.
Abstract
Short-term alpha signals are generally dismissed in traditional asset pricing models, primarily due to market friction concerns. However, this paper demonstrates that investors can obtain a significant net alpha by applying a combination of signals to a liquid global universe and with advanced buy/sell trading rules that mitigate transaction costs. The composite model consists of short-term reversal, short-term momentum, short-term analyst revisions, short-term risk, and monthly seasonality signals. The resulting alpha is present in out-of-sample and post-publication periods, across regions, translates into long-only applications, is robust to incorporating implementation lags of several days, and is uncorrelated to traditional Fama-French factors.
About the Author: Tommi Johnsen, PhD
—
Important Disclosures
For informational and educational purposes only and should not be construed as specific investment, accounting, legal, or tax advice. Certain information is deemed to be reliable, but its accuracy and completeness cannot be guaranteed. Third party information may become outdated or otherwise superseded without notice. Neither the Securities and Exchange Commission (SEC) nor any other federal or state agency has approved, determined the accuracy, or confirmed the adequacy of this article.
The views and opinions expressed herein are those of the author and do not necessarily reflect the views of Alpha Architect, its affiliates or its employees. Our full disclosures are available here. Definitions of common statistics used in our analysis are available here (towards the bottom).
Join thousands of other readers and subscribe to our blog.