Firm characteristics such as size, book-to-market ratio, profitability, and momentum have been found to be correlated with expected returns. The predictive power of these characteristics may stem from their industry component, their firm-specific component, or both. For example, while the study “Do Industries Explain Momentum,” found that momentum in stocks stems from the industry component, the study “The Other Side of Value: The Gross Profitability Premium,” found that the firm-specific component of characteristics contains most of the information, suggesting that an investor benefits from forming portfolios that neutralize sector exposures.
Sina Ehsani, Campbell Harvey, and Feifei Li contribute to the factor-based investing literature with their November 2021 study, “Is Sector-neutrality in Factor Investing a Mistake?,” in which they examined whether the within (firm-specific) component of stock characteristics contains more information about the cross-section of expected returns than the across (sector) component. For example, a technology firm may have a high book-to-market ratio (BM) relative to other tech firms, but a low BM relative to non-tech firms. Although the firm would be considered a value company compared to other tech firms, a long-short sort on BM will short this firm because firms in the tech sector generally have a lower BM.
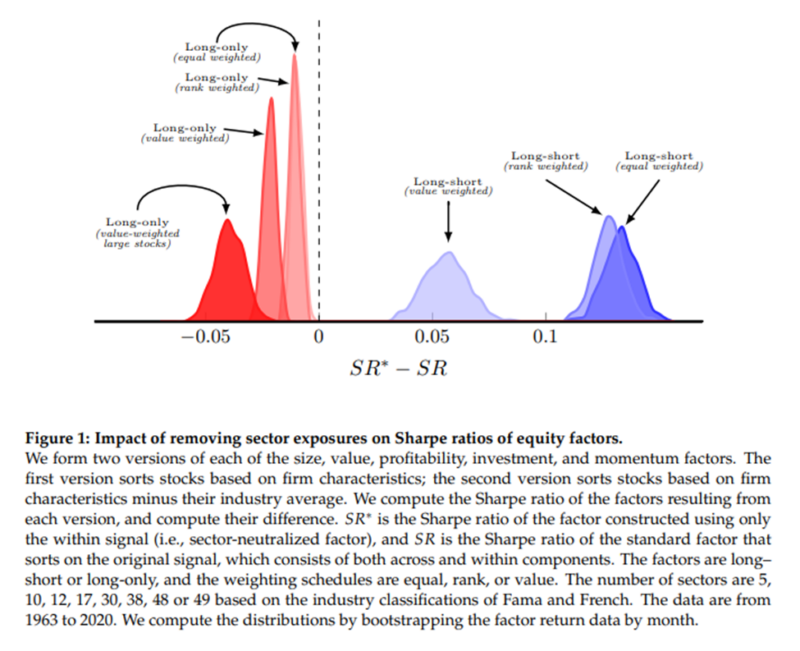
To answer their question, they used empirical bootstraps of historical data of factors, constructed using various portfolio construction techniques. Their measure of performance was the Sharpe ratio(1). Their data sample spanned the period 1963 to 2020. Following is a summary of their findings:
- The within (firm-specific) component of stock characteristics contains more information about the cross-section of expected returns than the across (sector) component. Size, value, and investment factors showed the largest gains.
- The long-short investor likely gains from sector neutralizing—keeping the sector component produced better long-short factors in only 20 percent of the trials.
- The within component of BM was strong in identifying the underperforming stocks of each sector that should go in the short leg, but did not predict the outperforming stocks of the long leg.
- Long-only factor performance is more likely to degrade from sector neutralizing—keeping the sector component produced better long-only factors in 78 percent of the trials. The largest negative from sector neutralizing occurred for the value-weighted long-only factors that trade large stocks, arguably the most investable portfolio.
Their findings led Ehsani, Harvey and Li to conclude:
“Across BM is better at predicting the outperforming sectors and the within BM is better at predicting the underperforming stocks within each sector. In retrospect, the maximum Sharpe-ratio strategy of the long–short value factor would be to form the long leg using sector BMs and to form the short leg using stock-specific BMs.”
In the investment world, different fund families take different approaches. For example, AQR uses sector neutrality in its long-short funds and also uses it in its long-only funds. Dimensional, which only has long-only funds, does not use a sector neutrality approach. Instead, it uses bands that constrain sector allocation from drifting too far from the eligible universe. And neither Bridgeway’s long-only funds nor Alpha Architect’s long-only funds use sector neutrality.
Investor Takeaway
Investors who pursue factor investing face numerous choices—choices that don’t end once the set of factors they wish to invest in has been chosen. One of the choices is whether the factors should be sector neutralized. Ehsani, Harvey, and Li provided information that can help you make an informed decision.
I would add that sector neutrality does reduce the risk of the behavioral problem of tracking variance (or error) regret. Thus, even though the research shows superior historical results for long-only portfolios that don’t consider sector neutrality, investors prone to that behavioral error might be willing to accept that trade-off. The tracking variance risk is why some funds might choose sector neutrality, as they recognize that most retail investors, and even most institutional investors, don’t have the required discipline to ignore negative short-term tracking variance.
Finally, the Ehsani, Harvey, and Li paper only examined a single factor at a time. However, what should matter most to investors is how that factor interacts with other factors both in the strategy/fund and in the overall portfolio itself. Looking at each factor separately (as the paper does) gets you the “best” answer for just that factor. But what really matters is the impact on the total portfolio. That is the essence of the “Larry Portfolio” (as described in “Reducing the Risk of Black Swans”) in which you can take a lot of factor risk to potentially get higher returns, and balance that with high-quality fixed income exposure to dampen the risk of the full portfolio.

About the Author: Larry Swedroe
—
Important Disclosures
For informational and educational purposes only and should not be construed as specific investment, accounting, legal, or tax advice. Certain information is deemed to be reliable, but its accuracy and completeness cannot be guaranteed. Third party information may become outdated or otherwise superseded without notice. Neither the Securities and Exchange Commission (SEC) nor any other federal or state agency has approved, determined the accuracy, or confirmed the adequacy of this article.
The views and opinions expressed herein are those of the author and do not necessarily reflect the views of Alpha Architect, its affiliates or its employees. Our full disclosures are available here. Definitions of common statistics used in our analysis are available here (towards the bottom).
Join thousands of other readers and subscribe to our blog.