MMPI in actuarial diagnosis of psychological disturbance among college males
- Cooke, J. K.
- Journal of Counseling Psychology, 14, 474-477
- A version of the paper can be found here.
- Want a summary of academic papers with alpha? Check out our free Academic Alpha Database!
Abstract:
An actuarial formula which reliably replicated 6 experienced clinicians’ ratings of the MMPI (Minnesota Multiphasic Personality Inventory) profiles of 200 college males was derived by linear regression techniques. The formula was able to duplicate the judges’ decisions more reliably (r = .91) than the judges were able to duplicate their own ratings at a later time (r = .83) or than they could agree among themselves (r = .80). The psychometric formula had the highest hit rate (85%) for the “nonpsychiatric” group, whereas the judges had the highest hit rate (74% and 84%, respectively) for the “campus psychiatric” and “hospital psychiatric” groups. Because the largest portion of a general college population is “nonpsychiatric,” this suggests that the psychometric formula had the highest hit rate for the overall male college population.
Prediction:
Estimate coefficient estimates from a multiple regression output relating MMPI scores to different psychiatric profiles as judged by experts (e.g., severe maladjustment–this person’s behavior should be so disturbed that hospitalization or serious difficulties with the environment seem imminent). The first finding is that the formulaic model does a great job replicating the results of the pooled ratings of the experts.
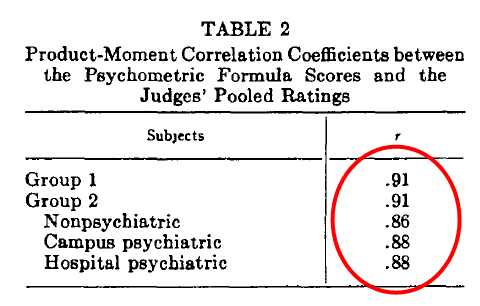
Note: Group 1 and Group 2 are 2 different samples of UNC undergrads that took MMPI tests in a psychology test. Nonpsychiatric are students who were not considering mental help; campus psychiatric sought mental help on campus; hospital psychiatric were students who had been hospitalized for mental issues.
Alpha Highlight:
This is where the study gets interesting. The author looks at how well the formula and the experts can replicate their original findings:
- Model replicated itself, obviously: 91% correlation with the experts’ assessment
- Individuals experts came to the same conclusion 83% of the time.
- Pooled expert opinion came to the same conclusion 80% of the time.
What the heck? Looking at the same data, experts come to much different conclusions?
Thoughts on the paper?

About the Author: Wesley Gray, PhD
—
Important Disclosures
For informational and educational purposes only and should not be construed as specific investment, accounting, legal, or tax advice. Certain information is deemed to be reliable, but its accuracy and completeness cannot be guaranteed. Third party information may become outdated or otherwise superseded without notice. Neither the Securities and Exchange Commission (SEC) nor any other federal or state agency has approved, determined the accuracy, or confirmed the adequacy of this article.
The views and opinions expressed herein are those of the author and do not necessarily reflect the views of Alpha Architect, its affiliates or its employees. Our full disclosures are available here. Definitions of common statistics used in our analysis are available here (towards the bottom).
Join thousands of other readers and subscribe to our blog.