We have already documented the returns to generic momentum investing strategies. Within the fund marketplace, many investors focus on fees and less on process. For example, Morningstar highlights the fees as “cost-efficient” for a specific momentum fund, MTUM. However, fees are only one part of an investment decision–process also matters–especially when it comes to momentum-based stock selection strategies. Here we hope to document how portfolio construction (number of stocks, holding period, and weightings) affects returns.
Our bottomline is as follows:
- Holding period matters: more frequent trading increases gross returns
- Portfolio size matters: more concentration increases gross returns
Our analysis of momentum investment strategies
We examine the top 1,000 largest US-exchange-traded common stocks each month (we eliminate REITs, ADRs, ETFs, and Closed-End Funds). We calculate the momentum variable as the cumulative returns over the past 12 months, ignoring the past month (academic construction). We allow the portfolio construction to vary across two dimensions:
- First, we examine the returns by varying the number of firms in the portfolio. We allow the portfolio size to vary from 50 to 500 stocks (Universe is the largest 1,000 stocks).
- Second, we examine the returns by varying the holding periods. We allow the holding periods to vary from 1 month to 12 months.
We select the top x number of firms ranked on momentum, every month. Here, the number of stocks x can be 50, 100, 150, 200, 250, 300, or 500. These firms are held in the portfolio for y months. The holding period (number of months) y varies from 1 to 12. Portfolios with holding periods over 1 month are formed by creating overlapping portfolios. (see Jegadeesh and Titman 1993).
The returns runs from 1/1/1970 to 12/31/2016 (momentum was calculated on 12/31/1969 for initial portfolio). Results are gross of fees. All returns are total returns and include the reinvestment of distributions (e.g., dividends).
Portfolio Performance
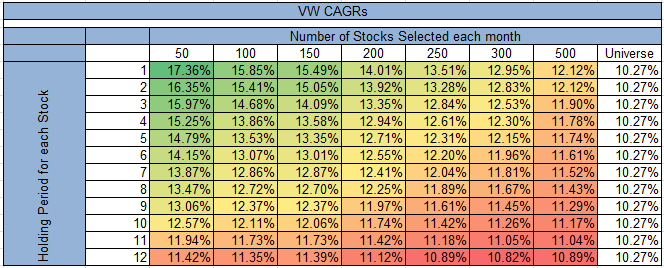
The results below reflect the compound annual growth rates for the various strategies from 1970-2016 for both value-weight and equal-weight portfolios. The value-weight monthly rebalanced 50 stock momentum strategy earns 17.36% CAGR, whereas the annually rebalanced 500 stock portfolio earns 10.89% CAGR. Important to note, all of these results are GROSS of transaction costs.
Value-weight Portfolios (1970-2016)
The results are hypothetical results and are NOT an indicator of future results and do NOT represent returns that any investor actually attained. Indexes are unmanaged, do not reflect management or trading fees, and one cannot invest directly in an index. Additional information regarding the construction of these results is available upon request.
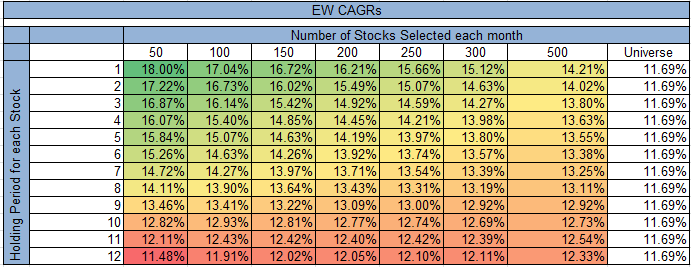
Equal-weight Portfolios (1970-2016)
The results are hypothetical results and are NOT an indicator of future results and do NOT represent returns that any investor actually attained. Indexes are unmanaged, do not reflect management or trading fees, and one cannot invest directly in an index. Additional information regarding the construction of these results is available upon request.
Clearly, there is a relationship between the number of firms, the holding period, and returns.
- The holding period is important. Holding the number of firms constant, the lower the holding period, the higher the CAGR. For the value-weight portfolios holding 50 stocks, the CAGR falls from 17.36% when holding the stocks for 1 month, to 11.42% when holding the stocks for 12 months.
- The number of firms is important. If we keep the holding period constant, the less firms in the portfolio, the higher the CAGR. For the value-weight portfolios with a holding period of one month, the CAGR falls from 17.36% when selecting the top 50 stocks, to 12.12% when selecting the top 500 stocks.
Overall, there is a near monotonic relationship along both dimensions (holding period and number of firms). The results are almost identical when equal-weighting the portfolios (higher CAGRs, similar pattern).
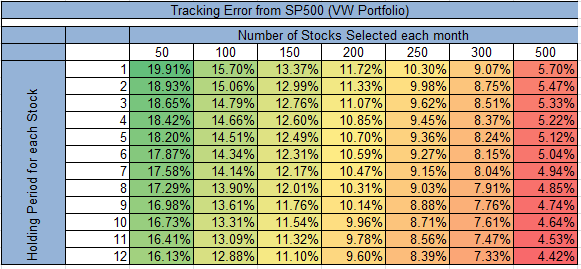
But not everything is perfect. We like to highlight one (potential) downside of a more concentrated portfolio — it will not track the value-weight index! One way to examine how the portfolios can vary from the passive index (in this case, the SP500) is to examine the tracking error of the portfolio relative to the SP500.(1)
Below we examine the tracking error of the value-weight portfolios relative to the SP500 from 1970 – 2016.
The results are hypothetical results and are NOT an indicator of future results and do NOT represent returns that any investor actually attained. Indexes are unmanaged, do not reflect management or trading fees, and one cannot invest directly in an index. Additional information regarding the construction of these results is available upon request.
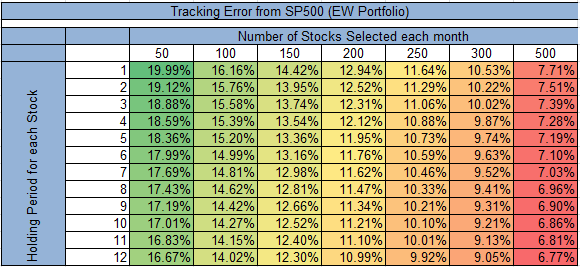
Similarly, we examine the tracking error of the equal-weight portfolios relative to the SP500 from 1970 – 2016.
The results are hypothetical results and are NOT an indicator of future results and do NOT represent returns that any investor actually attained. Indexes are unmanaged, do not reflect management or trading fees, and one cannot invest directly in an index. Additional information regarding the construction of these results is available upon request.
What pops out of the results is the following — the more concentration (as well as more rebalancing), the higher the tracking error. We recommend any potential investor in a highly concentrated momentum portfolio understand this ahead of time, and determine if one can withstand the tracking error pain.
Digging a little deeper into the results
Let’s examine the returns (with some more advanced statistics) on two portfolios. First, we will examine the 50 stock, 3-month holding period portfolio (equal-weighted), and compare this to a 150 stock, 6-month hold “low cost” momentum portfolio (value-weighted).
Here are the portfolios we examine:
- 50 stocks, 3M hold, EW = Top 50 firms ranked on momentum, held in the portfolio for 3 months. Portfolio is equal-weighted.
- 150 stocks, 6M hold, VW = Top 150 firms ranked on momentum, held in the portfolio for 6 months. Portfolio is value-weighted.
- VW Universe = Returns to the universe of the top 1,000 firms on market capitalization (with 12-month momentum calculation). Portfolio is value-weighted.
- SP500 = S&P 500 Total return
Results are gross of management fees and transaction costs. All returns are total returns and include the reinvestment of distributions (e.g., dividends).
Here are the returns (1/1/1970-12/31/2016):
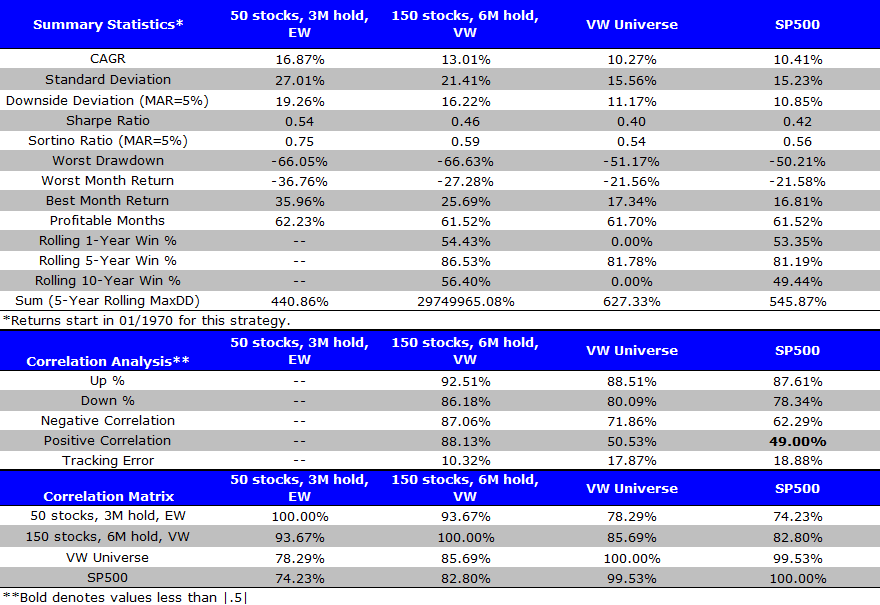
The results are hypothetical results and are NOT an indicator of future results and do NOT represent returns that any investor actually attained. Indexes are unmanaged, do not reflect management or trading fees, and one cannot invest directly in an index. Additional information regarding the construction of these results is available upon request.
Both momentum portfolios outperformed the index over the past 44 years (also note the high correlation between the universe of stocks and the SP500). This once again documents the out-performance of momentum strategies. However, there is a clear out-performance of the 50 stock, 3-month holding period portfolio (equal-weighted), relative to the 150 stock, 6-month holding period portfolio (value-weighted)–before fees and transaction costs. Would the marginal transaction costs between the two portfolios (rebalancing 4 times instead of 2 times each year, and equal-weighting as opposed to value-weighting) eat the 386 bps spread in returns?
Consider two momentum product offerings:
- Low scalability, high expected performance strategy: 50 stock quarterly rebalanced; 100bps management fee, 25bps rebalance fee
- 100bps + 4*25bps = 200bps in costs
- Gross CAGR = 16.87%, Net CAGR ~ 14.87%
- High scalability, lower expected performance strategy: 150 stock semi-annual rebalance; 25bps management fee, 25bps rebalance fee
- 25bps + 2*25bps = 75bps in costs
- Gross CAGR = 13.01%, Net CAGR ~ 12.26%
In the example above, the high octane, high cost momentum fund will have higher net returns relative to the low octane low cost momentum fund.
Of course, we can also come up with scenarios where the benefits of a more concentrated higher-frequency rebalanced momentum fund is negative. The question is — how high should the assumed transaction costs be? Check out the RAFI piece for more examples and in-depth analysis. The chart below from RAFI shows how important trading costs can be.
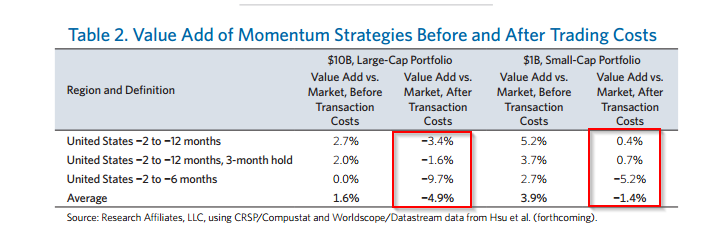
The results are hypothetical results and are NOT an indicator of future results and do NOT represent returns that any investor actually attained. Indexes are unmanaged, do not reflect management or trading fees, and one cannot invest directly in an index. Additional information regarding the construction of these results is available upon request.
In addition, we have written about transaction costs here, here, and here. We will let the reader decide the true costs.
Learning Points
This simple discussion should highlight a few things:
- Momentum works on a gross of fee basis.
- Momentum works even better when it is concentrated and traded frequently.
- A buyer of momentum products need to consider construction, asset scale, and trading capability of an asset manager before selecting a momentum fund
- The ideal momentum product built for expected performance is concentrated (~50 stocks), has high turnover (monthly-quarterly rebalance), and limited AUM (<$1B)
About the Author: Jack Vogel, PhD
—
Important Disclosures
For informational and educational purposes only and should not be construed as specific investment, accounting, legal, or tax advice. Certain information is deemed to be reliable, but its accuracy and completeness cannot be guaranteed. Third party information may become outdated or otherwise superseded without notice. Neither the Securities and Exchange Commission (SEC) nor any other federal or state agency has approved, determined the accuracy, or confirmed the adequacy of this article.
The views and opinions expressed herein are those of the author and do not necessarily reflect the views of Alpha Architect, its affiliates or its employees. Our full disclosures are available here. Definitions of common statistics used in our analysis are available here (towards the bottom).
Join thousands of other readers and subscribe to our blog.