Perfect foresight has great returns, but gut-wrenching drawdowns. In other words, an active investor who was clairvoyant (i.e. “God”),(1) and knew ahead of time exactly which stocks were going to be long-term winners and long-term losers, would likely get fired many times over if they were managing other people’s money.
Question: If God is omnipotent, could He create a long-term active investment strategy fund that was so good that He could never get fired?
The answer is striking: God would get fired.
Let that settle in a bit.
A PDF version of this is available here.
The design of our “God” study on active investors
We compute the 5-year “look ahead” return for all common stocks for the 500 largest NYSE/NASDAQ/AMEX firms. For simplicity, we eliminate any firms that do not have returns for a full 60 months.(2) We look at gross returns and all returns are total returns including dividends. Next, we create decile portfolios based on the forward five-year compound annual growth rate (CAGR).
We rebalance the names in the portfolio on January 1st of every fifth year. The first portfolio formation is January 1, 1927 and is held until December 31, 1931. The second portfolio is formed on January 1, 1932 and held until December 31, 1936. This pattern repeats every fifth year. To be clear, this is a non-investable portfolio that would require one to know with 100% certainty the performance of the top 500 stocks over the next 5 years.
To summarize, we are creating portfolios that are explicitly engaging in look-ahead bias. Clearly, these portfolios do not reflect anything even remotely possible in practice. The concept of this research is to capture results associated with a long-term investor (we assume a 5-year holding period) that has incredible stock-picking skill.
Returns are analyzed from 1/1/1927 to 12/31/2016.(3) Portfolios are value-weighted returns for month t are weighted using the market capitalization at the end of month t-1. All returns are gross of transaction costs, taxes, and fees.
Performance of the Decile Portfolios
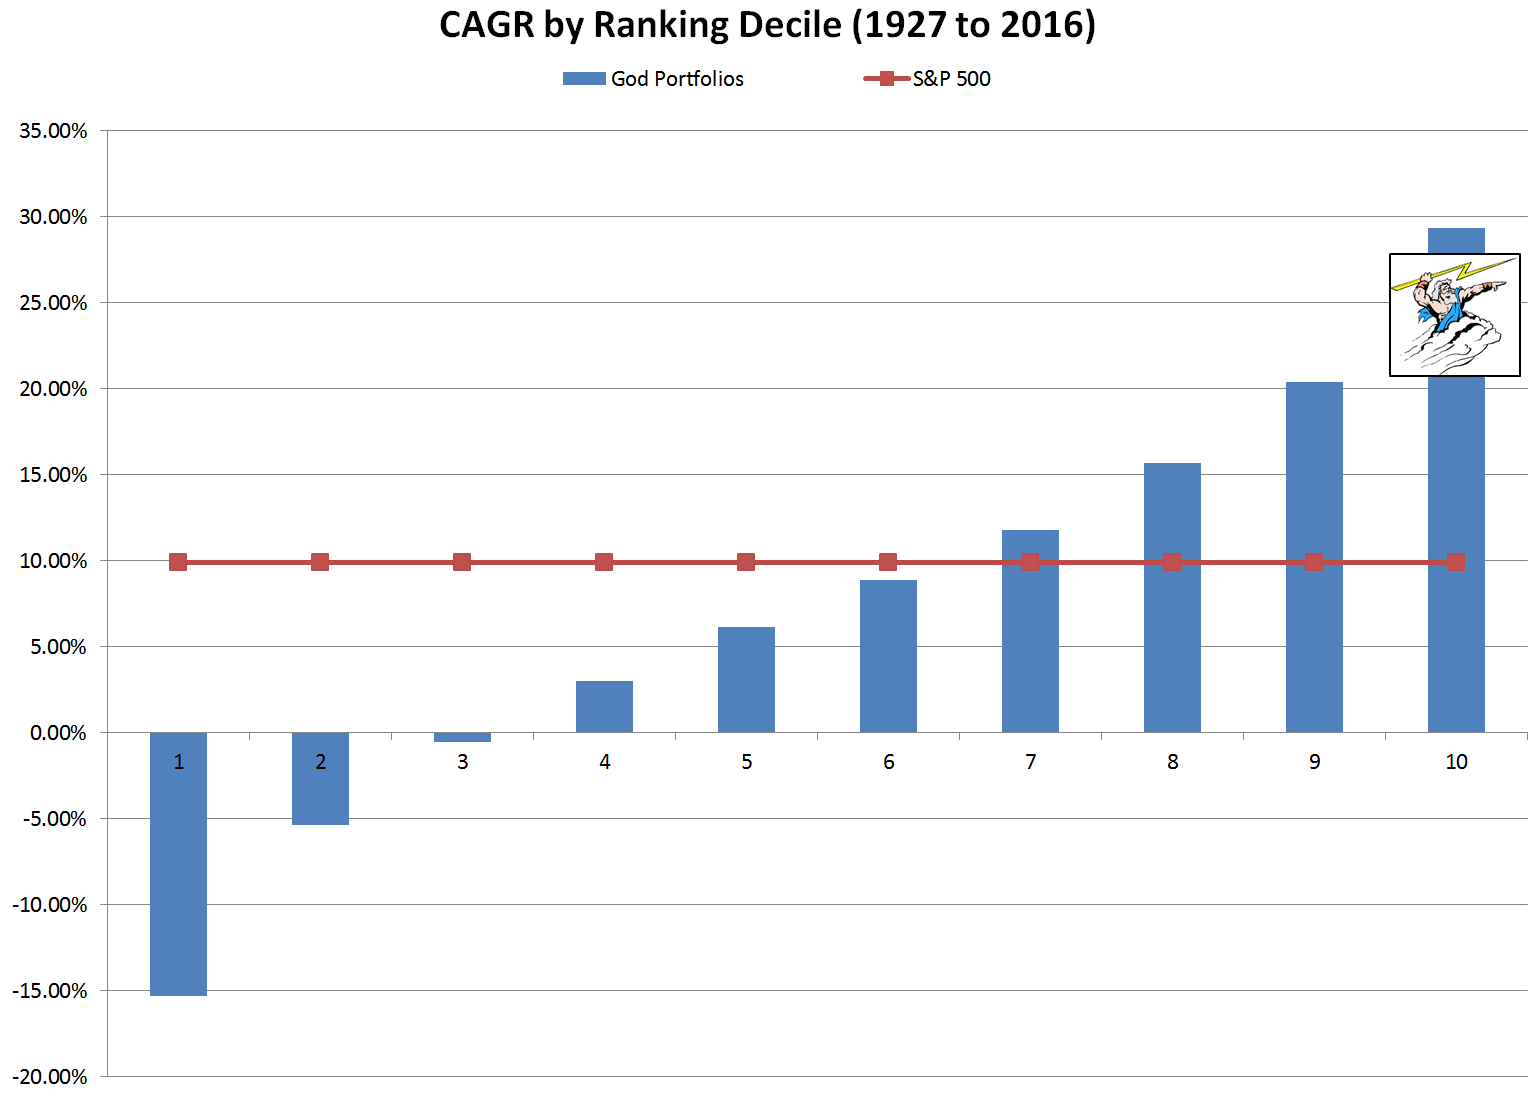
We first look at the decile portfolios rebalanced every 5 years. These portfolios highlight what perfect foresight can achieve. The Decile 10 portfolios represent value-weighted portfolios sorted on future top 5-year performers and the Decile 1 represents value-weighted portfolios sorted on future bottom 5-year performers. The compound annual growth rates for the 10 decile look-ahead portfolios are mapped below:
The results are hypothetical results and are NOT an indicator of future results and do NOT represent returns that any investor actually attained. In fact, these returns are EXPLICITLY IMPOSSIBLE TO ACHIEVE. Indexes are unmanaged, do not reflect management or trading fees, and one cannot invest directly in an index. Additional information regarding the construction of these results is available upon request. Note: these results were updated on 6/14/2017.
As expected, a portfolio formed on the names that have the best 5 -year performance, have the best 5-year performance. Duh. God would compound at nearly 29% a year, in theory. In practice, he would run into capacity constraints and own the entire market (see here for details).
We know God would knock it out of the park, but the details are interesting…
Summary Statistics
Here we investigate some statistics and charts on the performance of the 5-year look ahead portfolio.
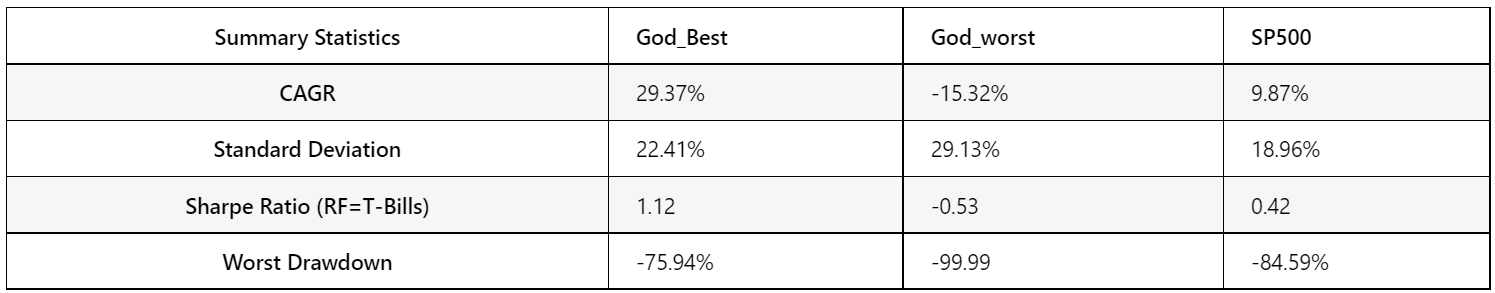
- God_Best = Top decile 5-year winner portfolio
- God_Worst = Bottom decile 5-year loser portfolio
- SP500 = S&P 500 Total Return Index
First, the raw summary statistics:
The results are hypothetical results and are NOT an indicator of future results and do NOT represent returns that any investor actually attained. In fact, these returns are EXPLICITLY IMPOSSIBLE TO ACHIEVE. Indexes are unmanaged, do not reflect management or trading fees, and one cannot invest directly in an index. Additional information regarding the construction of these results is available upon request. Note: these results were updated on 6/14/2017.
The 29% CAGR is obviously awesome for the look-ahead portfolio. Expected.
The volatility is high on the God_Best portfolio — higher than the market. Interesting.
The Sharpe Ratio is above 1, but not by much. A far cry from the 2+ Sharpe Ratios touted by some hedge funds. Interesting.
But how about them drawdowns! The perfect foresight portfolio eats a devastating 76% drawdown (Aug 1929 to May 1932). But the pain doesn’t end there, here is a chart of the drawdowns on the portfolio over time:
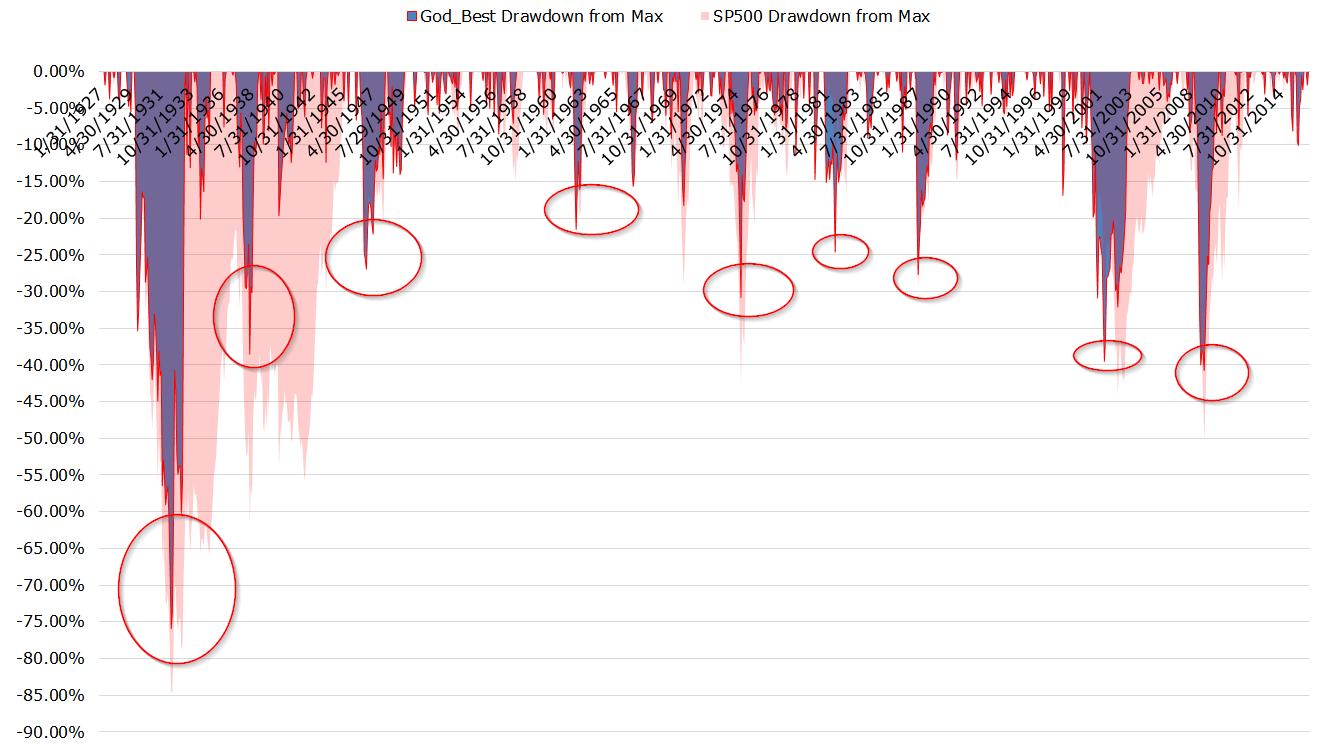
The results are hypothetical results and are NOT an indicator of future results and do NOT represent returns that any investor actually attained. In fact, these returns are EXPLICITLY IMPOSSIBLE TO ACHIEVE. Indexes are unmanaged, do not reflect management or trading fees, and one cannot invest directly in an index. Additional information regarding the construction of these results is available upon request. Note: these results were updated on 6/14/2017.
And here are some details on the drawdowns:
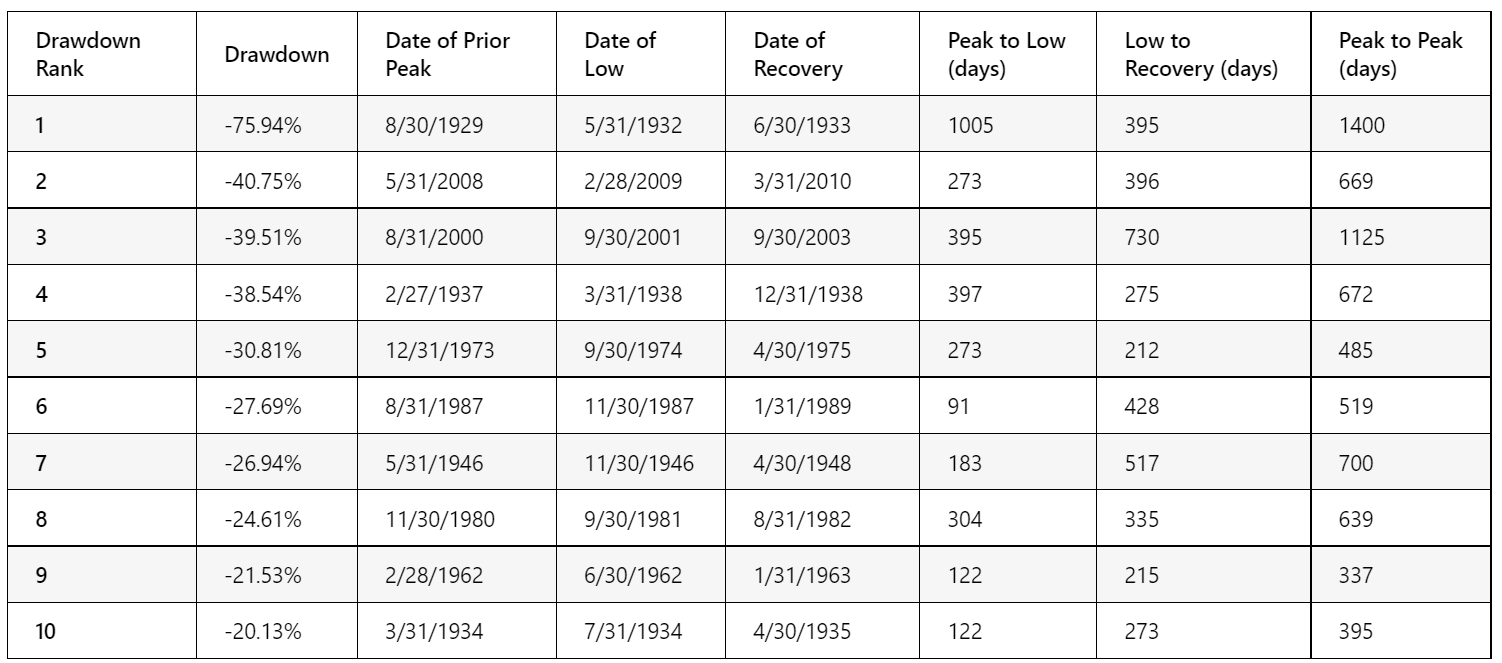
The results are hypothetical results and are NOT an indicator of future results and do NOT represent returns that any investor actually attained. In fact, these returns are EXPLICITLY IMPOSSIBLE TO ACHIEVE. Indexes are unmanaged, do not reflect management or trading fees, and one cannot invest directly in an index. Additional information regarding the construction of these results is available upon request. Note: these results were updated on 6/14/2017.
Clearly, even a “perfect” long portfolio can bring a long-only investor a ton of pain.
How about we create a Hedge Fund managed by God?
In the analysis above we highlight that God’s long portfolio can endure enormous drawdowns and enhanced volatility. But perhaps we can leverage God’s perfect foresight and go long the known winners and short the known losers. Slam dunk, right?
Let’s investigate…
God’s long/short portfolio is constructed as follows:
- Long God_Best and short God_Worst, rebalanced monthly.
The following portfolios are examined:
- God L/S = Long 5-year decile winners; short 5-year decile losers
- SP500 = S&P 500 Total Return index
Summary Statistics
Here are the high-level stats:
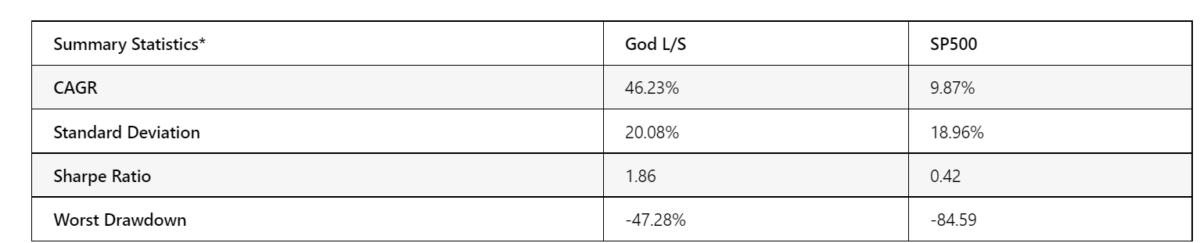
The results are hypothetical results and are NOT an indicator of future results and do NOT represent returns that any investor actually attained. In fact, these returns are EXPLICITLY IMPOSSIBLE TO ACHIEVE. Indexes are unmanaged, do not reflect management or trading fees, and one cannot invest directly in an index. Additional information regarding the construction of these results is available upon request. Note: these results were updated on 6/14/2017.
Yowza!
Clearly, the ultimate hedge fund does amazingly well — 46% CAGRs would have you owning the world’s stock market in short order. Obviously, consistently outperforming the market is not possible over a long period — even if someone had perfect “Biff-like” foresight.
Yet, check out the worst drawdown on the PERFECT hedge fund — 47%+. Incredible. And it gets better…
Here is the time series of drawdowns over time for the God L/S portfolio. Certainly not a cakewalk!
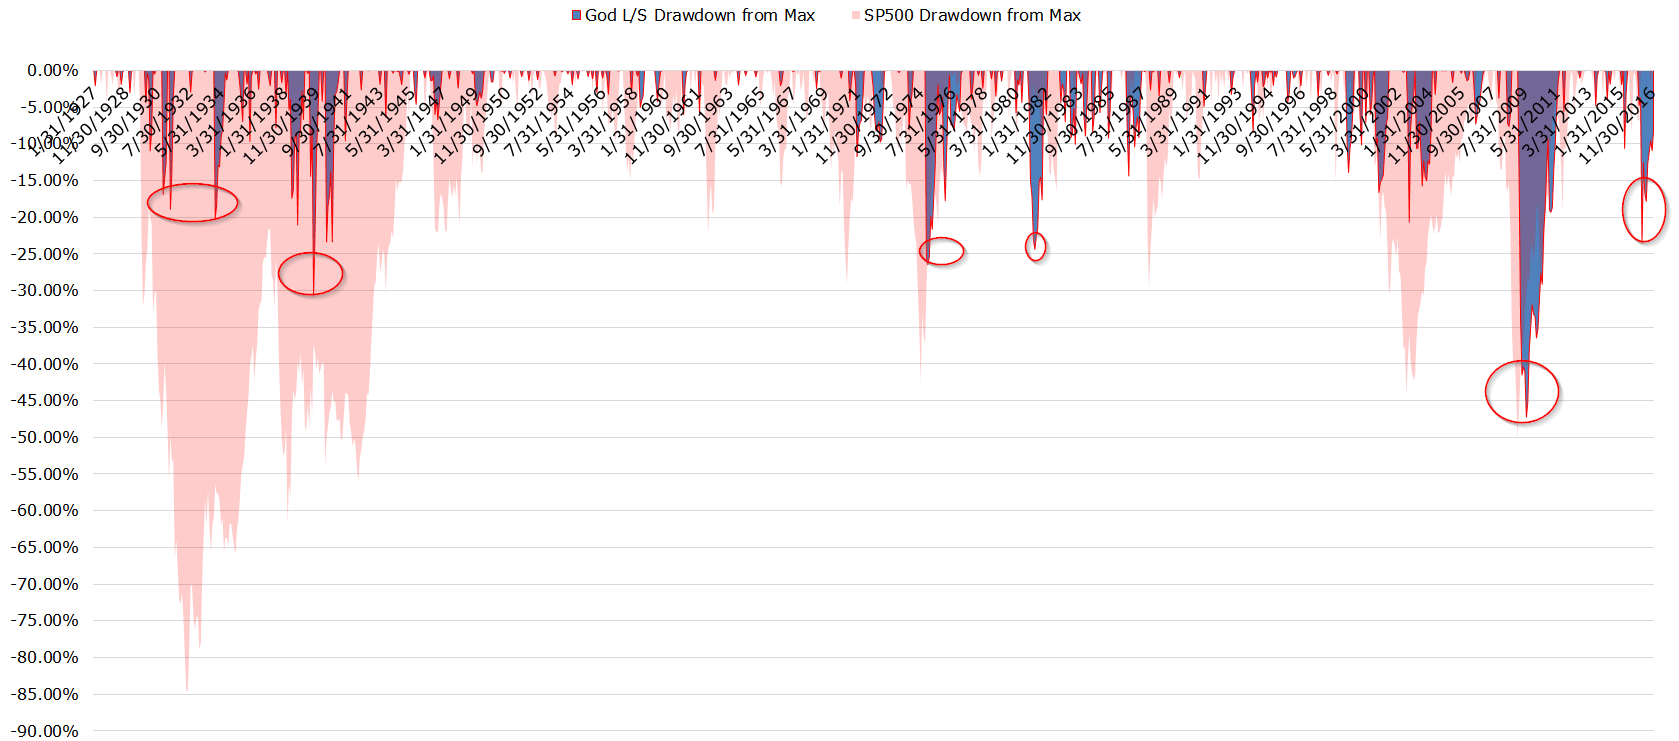
The results are hypothetical results and are NOT an indicator of future results and do NOT represent returns that any investor actually attained. In fact, these returns are EXPLICITLY IMPOSSIBLE TO ACHIEVE. Indexes are unmanaged, do not reflect management or trading fees, and one cannot invest directly in an index. Additional information regarding the construction of these results is available upon request. Note: these results were updated on 6/14/2017.
Let that chart sink in a bit. Multiple opportunities to lose 20%+ over time. Clearly not riskless. But it gets even better…
As many investment pros painfully recognize, managing money is often not about absolute performance, but relative short-term performance. Another truism is that the S&P 500 ends up being everyone’s benchmark, regardless of the strategy — especially during a long-term bull market!
Let’s look at the 1-year relative CAGR over time between God L/S and the S&P 500.
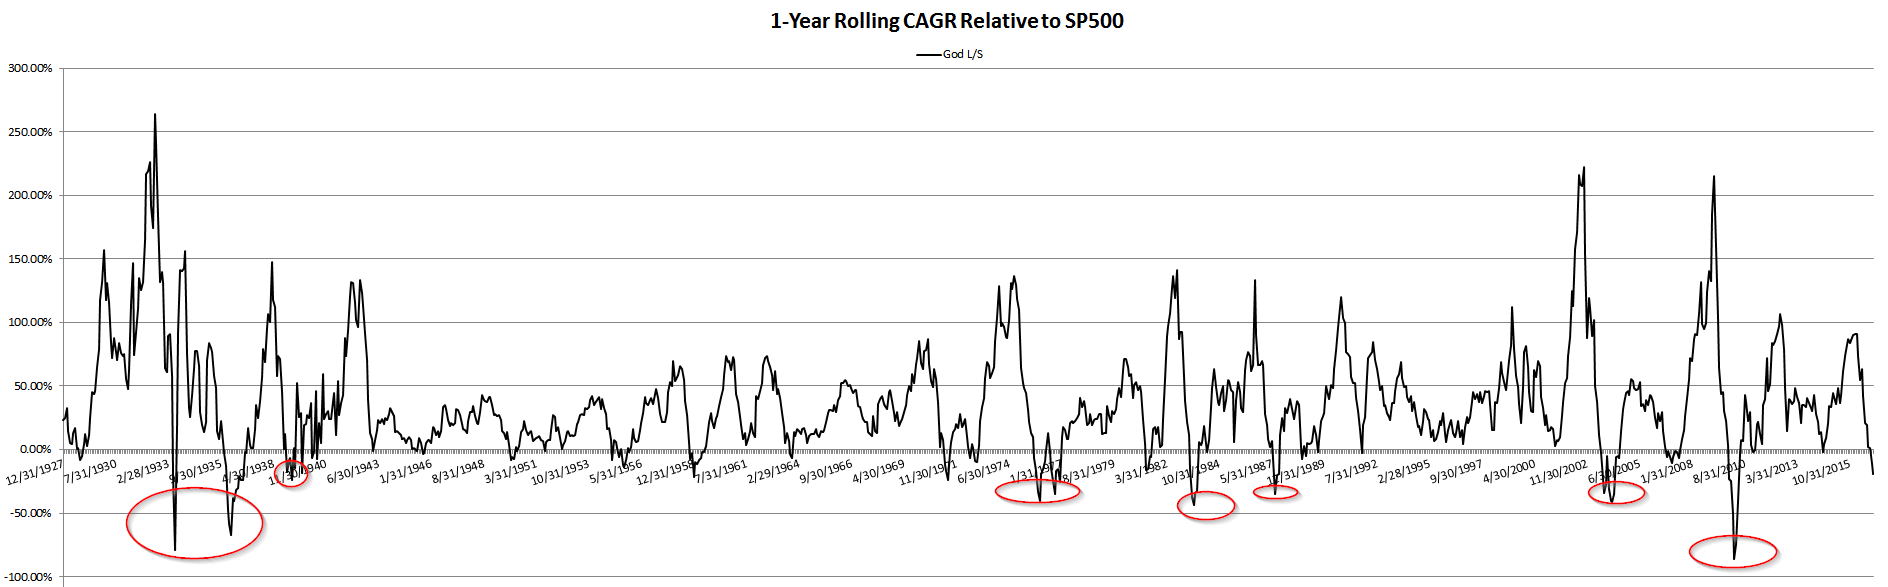
The results are hypothetical results and are NOT an indicator of future results and do NOT represent returns that any investor actually attained. In fact, these returns are EXPLICITLY IMPOSSIBLE TO ACHIEVE. Indexes are unmanaged, do not reflect management or trading fees, and one cannot invest directly in an index. Additional information regarding the construction of these results is available upon request. Note: these results were updated on 6/14/2017.
What the chart highlights is that even God would get fired multiple times over. The relative performance of God’s hedge fund is often abysmal and he’d surely make the cover of Barron’s or the WSJ on multiple occasions throughout his career. The passive index would eat his lunch on multiple occasions — often getting beaten by 50 percentage points — or more — on multiple occasions!

These results highlight the fickle nature of assessing relative performance over short horizons. We’ve shown this quantitatively, but Ben Carlson talks about the challenge of short-horizon thinking here, and Meb Faber recently highlighted that investors are terrible at timing active investments.
Conclusions
The famous quote attributed (wrongly?) to Keynes is spot-on:
Markets can remain irrational longer than you can remain solvent!
This study also highlights a truism for all active investors:
Active investors MUST have a long-horizon!
Our mission is to empower investors. If you found this blog useful, please sign up for our newsletters (4)
References[+]
| ↑1 | We mean no offense by the use of the term and this could be construed as a single deity, multiple deities, or whatever fulfills your definition of an entity or concept that is all-powerful and all-knowing. |
|---|---|
| ↑2 | Results are similar with or without this assumption. |
| ↑3 | The results for the 2016 portfolio are derived from the returns on the “perfect” portfolio in 2011. |
| ↑4 | h.t., Arturo B. . An old Chicago PhD (1980) we met at the Nantucket Project, who inspired this research question… |
About the Author: Wesley Gray, PhD
—
Important Disclosures
For informational and educational purposes only and should not be construed as specific investment, accounting, legal, or tax advice. Certain information is deemed to be reliable, but its accuracy and completeness cannot be guaranteed. Third party information may become outdated or otherwise superseded without notice. Neither the Securities and Exchange Commission (SEC) nor any other federal or state agency has approved, determined the accuracy, or confirmed the adequacy of this article.
The views and opinions expressed herein are those of the author and do not necessarily reflect the views of Alpha Architect, its affiliates or its employees. Our full disclosures are available here. Definitions of common statistics used in our analysis are available here (towards the bottom).
Join thousands of other readers and subscribe to our blog.