In the 1950s, Harry Markowitz proposed a method to identify the optimal trade-off between risk and return for a portfolio. The theory is broadly termed, “Mean-Variance Optimization (MVO).”
Sam Wittig, a Drexel graduate I advised and who did some research for Alpha Architect, shared with us his undergraduate thesis project regarding Markowitz’s analysis.
Here is a link to Sam’s work: Shrinkage Theory for Portfolio Optimization with Correlated Geometric Brownian Motion. It’s open for debate, but this might just be the sexiest title for a paper ever, we’ll leave it up to our readers to decide.
Sam did a lot of great work on his thesis, and I thought it would be interesting to share two key findings with our readers.
Finding 1: Markowitz vs. Shrinkage
“The objective of this paper was to focus on the errors created by the sample covariance matrix within Markowitz portfolio optimization, and how “shrinkage” can be used to reduce the error within this matrix.”
One key criticism of Markowitz’s MVO analysis is its estimation error. To be specific, the covariance matrix is measured using a finite number of observations. The “optimal” weights might be affected by the extreme values in limited sample data. We’ve mentioned this issue here and it is explained in detail in this paper.
A shrinkage estimator is a statistical technique that has some bias (the estimate is biased from the true population parameter), but the estimator is less noisy (ie, less variance). Sam tests whether a “shrinkage” estimator can help improve the performance of the MVO. Sam finds little evidence that the Shrinkage portfolio produces better results. Here is a formal paper on the subject with a great title, “Honey, I shrunk the sample covariance matrix.”
Finding 2: How much data is necessary to make accurate predictions?
“One of the main hypothesis behind any data analysis is that the larger the data set becomes, the more accurate and predictable future results will be… “
Is more always better? To test this question, we need a benchmark to be compared with. Sam chooses the Ground Truth (GT) portfolio. “The GT portfolio was a Markowitz portfolio with the maximum amount of historical data available.” That says, GT portfolio shall provide the most accurate future results based on the limited historical data.
Sam tests several different sample period: 3 months, 6 months, 1 year, 3 years, 5 years, and 10 years. He creates a simulation of the financial markets by using Correlated Geometric Brownian Motion (CGBM). Using the returns from the simulation, the data was tested using the Markowitz and Shrinkage portfolios. Then he compares the basic metrics (the rate of return, volatility, Sharpe ratio, etc) with those of GT portfolio.
Below table shows the results:
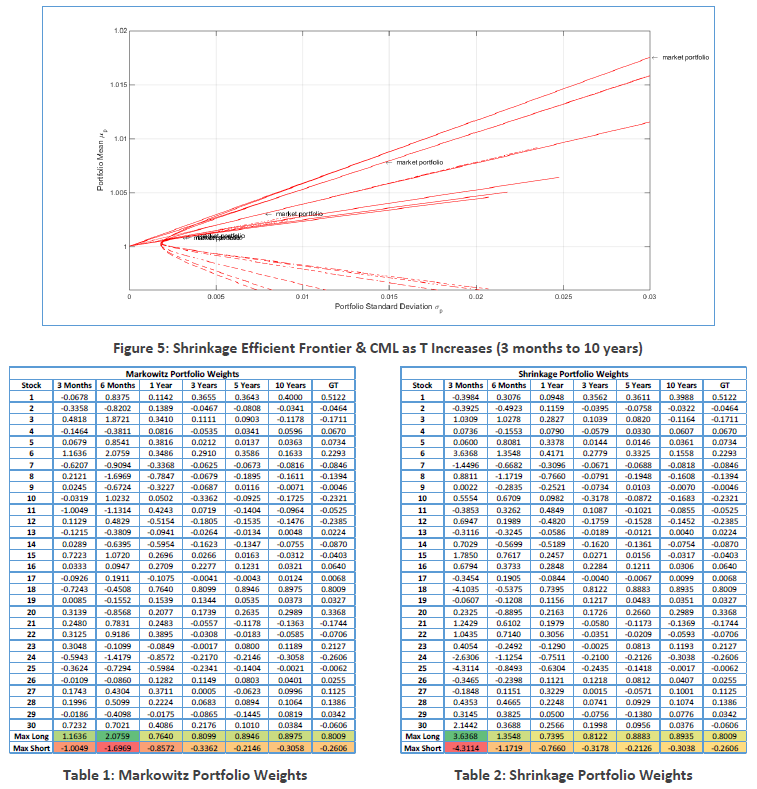
The long and short positions are extreme when dataset is short (3 months and 6 months).
When dataset length increase, the metrics began to stabilize and converge toward the values of the GT portfolio.
So, Sam concludes that “as T increased, the predictability of the market improved.”
Concluding Thoughts
From Sam’s essay:
Lastly, all who strive to understand Harry Markowitz’s portfolio optimization methods should think very hard about what they are trying to accomplish. Even the Nobel Prize winner himself was still not convinced of his own methods even decades later when he was discussing the 1987 stock market crash.
And we’ll leave the last word to Harry Markowitz:
“I should have computed the historical covariances of the asset classes and drawn an efficient frontier… I split my contributions 50/50 between stocks and bonds.” – Harry Markowitz
About the Author: Wesley Gray, PhD
—
Important Disclosures
For informational and educational purposes only and should not be construed as specific investment, accounting, legal, or tax advice. Certain information is deemed to be reliable, but its accuracy and completeness cannot be guaranteed. Third party information may become outdated or otherwise superseded without notice. Neither the Securities and Exchange Commission (SEC) nor any other federal or state agency has approved, determined the accuracy, or confirmed the adequacy of this article.
The views and opinions expressed herein are those of the author and do not necessarily reflect the views of Alpha Architect, its affiliates or its employees. Our full disclosures are available here. Definitions of common statistics used in our analysis are available here (towards the bottom).
Join thousands of other readers and subscribe to our blog.