Now that the Federal Reserve has begun the process of raising interest rates, and has announced their intention to begin to unwind their policy of quantitative easing (reducing the amount of bonds in their portfolio, either by selling holdings or allowing holdings to mature), investors may be concerned about the impact of rising interest rates on factor premiums.
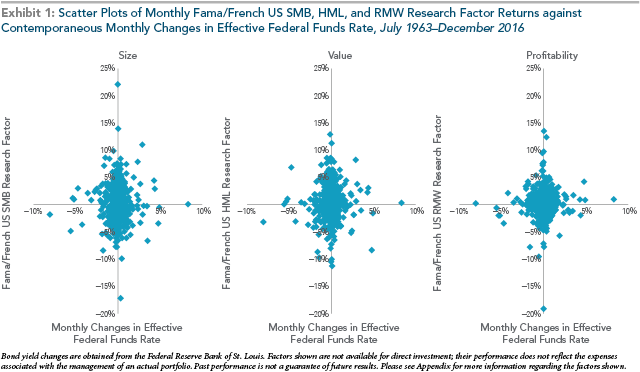
Wei Dai, senior researcher at Dimensional Fund Advisors, studied the relationship between interest rates and the dimension of expected stock returns in a July 2017 paper. Dai examined the relationship of the realized size, value and profitability premiums over the period from July 1963 through December 2016.
Dai found that while the realized size, value and profitability premiums have been positive on average, there has been substantial dispersion of their realized returns over time. However, there has been no discernable pattern in the historical data suggesting that the size, value and profitability premiums behaved differently in months when the effective federal funds rate went up versus when it went down. And Dai found that the lack of clear patterns held when the federal funds rate was replaced with one-, five- and 10-year Treasuries.You can see the lack of patterns in the exhibit below.
One can see the lack of patterns in the exhibit below:
The results are hypothetical results and are NOT an indicator of future results and do NOT represent returns that any investor actually attained. Indexes are unmanaged, do not reflect management or trading fees, and one cannot invest directly in an index. Additional information regarding the construction of these results is available upon request.
Dai also found that the R² values (a measure of explanatory power), regardless of which bond yield was used, were close to zero. Thus, bond yields have explained almost none of the variation in the size, value, and profitability premiums.
Dai concluded:
There is no compelling evidence supporting a robust relation between interest rate changes and the size, value, and profitability premiums.
The conclusion you should draw is that even if you had perfect foresight of interest rate changes (and no such person exists), it would not provide you with information as to future factor premiums. The one exception is that some research, such as the 2016 study by Joost Driessen, Ivo Kuiper and Robbert Beilo, “Does Interest Rate Exposure Explain the Low Volatility Anomaly?”, has found that low-volatility strategies have exposure to term risk (the duration factor). This should not be a surprise because, generally speaking, low-volatility (or low-beta) stocks are more “bond like.” They are typically large stocks, the stocks of profitable and dividend-paying firms, and the stocks of firms with mediocre growth opportunities. In other words, they are stocks with the characteristics of safety as opposed to risk and opportunity. Thus, they show higher correlations with long-term bond returns.
In summary, Dai’s findings on trying to time factor premiums based on interest rates is consistent with other research into whether investors can accurately time premiums using variables besides interest rates, such as valuation ratios and mean reversion. Dai noted that various metrics have been tested and so far the evidence suggests that “rather than making investment changes based on these predictions or views and risking the potentially huge opportunity costs of mistiming the premiums, a more reliable way to pursue higher expected returns is to remain focused on the premiums.”
Further Evidence on Timing Factors
Clifford Asness, Swati Chandra, Antti Ilmanen and Ronen Israel contribute to the literature on timing factor investing with their study “Contrarian Factor Timing is Deceptively Difficult,” which appears in the 2017 special issue of The Journal of Portfolio Management. Among their findings was that, when comparing the impact of value timing (in other words, can dynamic allocations improve the performance of a diversified multi-style portfolio?), they uncovered “lackluster results—strategic diversification turns out to be a tough benchmark to beat.”
The results are hypothetical results and are NOT an indicator of future results and do NOT represent returns that any investor actually attained. Indexes are unmanaged, do not reflect management or trading fees, and one cannot invest directly in an index. Additional information regarding the construction of these results is available upon request.
Asness, Chandra, Ilmanen and Israel noted that value timing of factors, because it is buying what is relatively cheap, is correlated to the standard value factor as it adds further value exposure to a portfolio.
They explain:
If a multi-style portfolio already includes value at optimally diversified levels, value timing the styles may increase value exposure to levels that undermine diversification, leading to weaker performance, particularly in a risk-adjusted sense. For many investors, the original intention of a multi-style allocation is to balance risk across multiple sources of return and capitalize on the power of diversification. Value timing a multi-style allocation may work against that very purpose by effectively increasing the allocation to value.
They add:
Portfolio math tells us that returns add linearly while risk adds quadratically. Hence, at larger tilts, the increase in risk from timing may be proportionately larger than any increase in return, resulting in lower risk-adjusted returns.
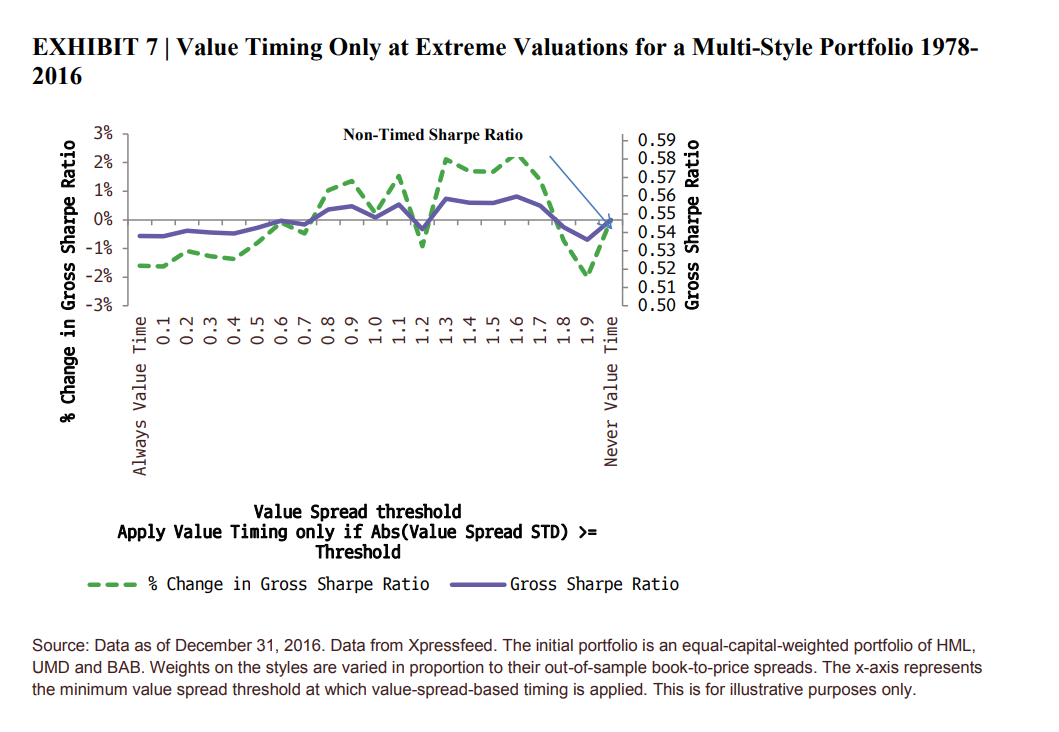
The authors also examined whether timing would add value if it were done only at extreme levels—when spreads passed a certain threshold. They write:
The timed strategy Sharpe ratio improves as we increase the threshold, but it is a very modest improvement. The timed strategy Sharpe ratio barely exceeds the Sharpe ratio of the non-timed. In fact, increasing the threshold further leads to a slight drop in the Sharpe ratio.
The results are hypothetical results and are NOT an indicator of future results and do NOT represent returns that any investor actually attained. Indexes are unmanaged, do not reflect management or trading fees, and one cannot invest directly in an index. Additional information regarding the construction of these results is available upon request.
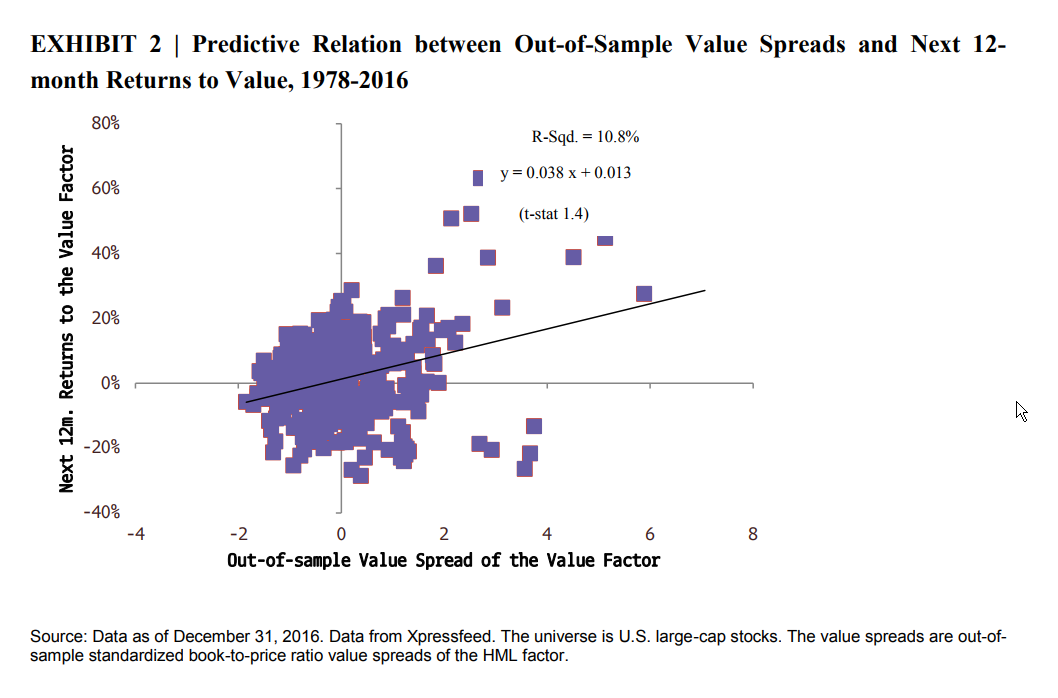
Dai herself also looked at the issue of timing premiums in her March 2016 paper, “Premium Timing with Valuation Ratios.” She studied the performance of the market, size and value premiums over the period from July 1926 through June 2015, as well as the performance of the profitability premium for the period from July 1963 through June 2015. Looking for trading rules that outperformed the long-only benchmarks by at least 25 basis points per year (to at least cover a minimal estimate of implementation costs), Dai examined timing strategies that trade back-and-forth between the long and the short sides of the premiums in an attempt to generate abnormal returns. Because the observations of valuation spreads are available on an annual basis, the strategies rebalanced annually on June 30.
Dai considered nonparametric trading rules (meaning that no assumptions regarding the probability distributions of the variables being assessed were made) that invest in the long side of a premium and then move into the short side when the valuation spread of interest is small. For example, when the book-to-market spread between value and growth is small, it suggests the subsequent value premium may be low, so the trading rule invests in the growth side.
To implement such a strategy, it is necessary to define a “small” valuation spread. Small spreads are defined as those below the 10th, 20th or 50th percentile (breakpoint) of the historical distribution. Dai also considered various strategies for when to switch back, including when the spread crosses a breakpoint, and until it crosses the 50th percentile. She also examined data that covered the full period, as well as data that covered only the most recent 20-year periods. For each pair of premiums and valuation spreads, Dai ran a variety of trading rules defined by breakpoint, switchback and window. In all, he tested 200 trading rules.The following is a summary of her findings:
The following is a summary of her findings:
- There were only five rules that showed reliably positive excess returns sufficient to cover the low trading cost hurdle of 0.25 percent.
- The attempt to time the market premium was the least successful, as none of the rules yielded higher returns than the simple strategy of remaining in the stock market all the time.
Dai also tested 480 parametric trading rules (rules that employ a regression approach to forecast future premiums). Since a premium is constructed by subtracting the return on the short side from the return on the long side, they reflect the relative performance of each side. Thus, the trading rule invests in the side of a premium that is predicted to do better (or the one that is more likely to do so). She found that only about 2 percent of simulations produced a reliably positive excess return greater than trading costs.
Given the large number of simulations, we should expect some chance of what is called a “false discovery.” For example, under a simplified multiple-testing framework in which trials are independent, about 5 percent of trials will appear statistically significant even if all the signals are pure noise.
Lack of Robustness
To have confidence in an investment strategy, the evidence should be not only persistent and pervasive, but should also be robust to various definitions. For example, we would not have the level of confidence we do in the value premium if it only existed when we measured value using the metric of price-to-book. There’s a very similar premium when we measure value using other metrics, such as price-to-cash flow, price-to-earnings, price-to-sales, and price-to-dividends.
Similarly, there’s a strong momentum premium whether we measure momentum by 12 months, nine months or six months. The profitability premium is strong whether it’s measured by profits-to-sales or profits-to-assets, or even cash flow-to-assets. Given that Dai found only about 2 percent of trading rules passed the test, we cannot achieve the same level of confidence in the robustness of a premium timing strategy. Dai concluded that, “The percentages observed here do not constitute strong evidence that one can reliably time the subsequent year’s premiums using valuation spreads.”
Furthermore, there is still other research investigating the variables that can be used to time markets. The 2007 study, “Does Predicting the Value Premium Earn Abnormal Returns?” by Jim Davis of DFA, examined style-timing strategies over the period from July 1927 through June 2005. Davis found that style-timing rules did not generate high average returns, despite being able to use future information about book-to-market spreads. The key statistics from the original study are presented in the table below:
Average Annual Returns and Annual Standard Deviations for Style Timing Rules (standard deviations are in parentheses)
| Portfolio Strategy | July 1927–June 2005 | July 1945–June 2005 |
| Stay in value all the time | 19.13 | 16.97 |
| (45.14) | (19.81) | |
| Move to growth when: | ||
| BtM Difference below average | 16.24 | 15.83 |
| (45.51) | (20.53) | |
| BtM Multiple below average | 16.84 | 15.29 |
| (44.91) | (20.92) | |
| BtM Difference in bottom 20% | 19.21 | 16.82 |
| (45.20) | (20.15) | |
| BtM Multiple in bottom 20% | 18.72 | 16.49 |
| (45.59) | (21.14) | |
The results are hypothetical results and are NOT an indicator of future results and do NOT represent returns that any investor actually attained. Indexes are unmanaged, do not reflect management or trading fees, and one cannot invest directly in an index. Additional information regarding the construction of these results is available upon request.
In fact, he concluded that the expected excess return of style timing is probably negative, for the same reasons that efforts to time the overall market are likely to fail. Just as ex-ante there should always be an equity risk premium, ex-ante there should always be a value risk premium. And as is the case with the equity risk premium, the value premium is so large that any trading strategy would have to be right almost all of the time to deliver successful results. It would be like switching from the high-speed carpool lane to the center lane on a crowded freeway. Your “freeway algorithm” might help predict when the carpool lane or center lane will move faster or slower than normal. But will it be accurate enough to justify switching into the slower lane in an effort to get to your destination quicker? The evidence suggests that you are better off staying in the carpool lane. The lesson for investors is that just because a statistical relationship exists does not necessarily imply that a profitable trading strategy based on that relationship exists as well, especially after taking into account trading and other costs.
There’s also the study, “Is There Value in Valuation,” which appeared in the Winter 2013 issue of The Journal of Portfolio Management. The authors, Martin Fridson and John Finnerty, studied whether a valuation-based rotation strategy worked for high-yield bonds. They first showed that a rotation strategy seemed to have great appeal. For example, for the period from 2007 through 2011, even though mean returns for BB-, B- and CCC-rated bonds were 9.9 percent, 8.3 percent and 15.2 percent, respectively, choosing the best-performing sector would have produced a return of 21.0 percent. Clearly, there’s a large opportunity to add value.

The results are hypothetical results and are NOT an indicator of future results and do NOT represent returns that any investor actually attained. Indexes are unmanaged, do not reflect management or trading fees, and one cannot invest directly in an index. Additional information regarding the construction of these results is available upon request.
Before getting into their findings, it’s important to understand that, in general, you should expect the lowest-rated bonds (CCC) to outperform when the risk premium (or incremental yield over Treasuries) for high-yield bonds decreases and underperform when it increases. This should certainly be true if the change in risk premiums is large. (If the risk premium widens by a small amount, it’s possible that the higher yield of the lower-rated bond would provide enough of a cushion for them to still outperform.)
This is all intuitive. If a risk premium falls, the riskier asset class should outperform, and vice versa. And if this is true, then we don’t need information about relative valuations to inform us about which sector/asset class will outperform. We only need to forecast whether the premium will widen or not. (The evidence on active management demonstrates that managers don’t have much success at that endeavor.) Studying the quarterly results for the period from 1997 through 2011, this is exactly what Fridson and Finnerty found.
Using what is called the option-adjusted spread (OAS) to take into account the call risk inherent in corporate bonds, they found that this relationship held true 76 percent of the time for B and BB bonds, 83 percent of the time for B and CCC bonds and 86 percent of the time for BB and CCC bonds. This finding very clearly calls into question a valuation-based trading strategy. To know which sector to move into, all you need is to accurately forecast whether the premium for the entire asset class will rise or fall. If the premium is going to narrow, own the lowest-rated bonds. If it’s going to widen, own the highest-rated bonds.
To test whether a valuation-based approach was likely to add value, Fridson and Finnerty built a five-factor valuation model (credit availability, capacity utilization, industrial production, speculative-grade default rate and yield to maturity on the five-year Treasury). If the OAS spread was greater than the model predicted, the asset was cheap (you should rotate into it). The asset would be expensive (you should rotate out of it) if the spread was less than fair value. The model explained a high percentage, between 74 percent and 80 percent, of the variance in performance.
Unfortunately, using various tests, the authors found no statistically significant benefit from a sector rotation strategy based on the valuation model. It’s also important to observe that high-yield bonds are an expensive asset class to trade. As a result, even if there appeared to be some theoretical advantage to a rotation strategy, the advantage could very well be ephemeral with trading costs creating a large hurdle to overcome.
Summary
As tempting as the proposition might be, there doesn’t seem to be much, if any, evidence that a factor-timing (i.e., style-timing) strategy can be expected to be profitable going forward. These findings add further support to investors building portfolios that are strategically (as opposed to tactically) diversified across each of the factors that show persistence of their premiums, low correlation to other factors, are pervasive around the globe and across asset classes, have intuitive reasons to believe the premiums should persist (whether behavioral-based or risk-based) and are implementable (meaning they survive transaction costs).
About the Author: Larry Swedroe
—
Important Disclosures
For informational and educational purposes only and should not be construed as specific investment, accounting, legal, or tax advice. Certain information is deemed to be reliable, but its accuracy and completeness cannot be guaranteed. Third party information may become outdated or otherwise superseded without notice. Neither the Securities and Exchange Commission (SEC) nor any other federal or state agency has approved, determined the accuracy, or confirmed the adequacy of this article.
The views and opinions expressed herein are those of the author and do not necessarily reflect the views of Alpha Architect, its affiliates or its employees. Our full disclosures are available here. Definitions of common statistics used in our analysis are available here (towards the bottom).
Join thousands of other readers and subscribe to our blog.