But there’s a problem with price/book: today’s economy. Price/book, perhaps the most conventional measure of value, evaluates stock prices based on a company’s book value—the worth of all tangible assets but no intangible ones…Today’s service economy is filled with companies whose biggest assets are their brands, intellectual property, or customer loyalty, which don’t show up on the balance sheet.
But as Wes highlighted not that long ago in a WSJ piece, determining if value investing is dead, really hinges on how one measures “value investing.”
In this piece, we look at the performance of various value investing screens from 2000 to 2018 across the globe to garner some more insight on how value investing has faired in recent memory. The results suggest a mixed view on value. There is no conclusive evidence that value is dead, but there is also no clear case that value has done well.
Valuation Horse Race Methodology
Systematic value investors face a lot of options when deciding which value metric they should utilize when constructing their portfolios. Historically, investors have focused on the price-to-book ratio, which is still the preferred metric in some sectors, e.g. REIT specialists in Europe and Asia continue to focus on premium and discount to book values as it is a very intuitive measure for identifying value in the real estate sector. However, in most sectors investors tend to focus on earnings or cashflow-based metrics. In this short research note, we will compare different value metrics across the globe and evaluate utilizing a multi-metric approach. Wes and Jack have done a similar analysis for the US market over a 40-year period, which can be contrasted with the results below.
We focus on value portfolios in the US, Europe and Japan and the following four valuation metrics: price-to-book (P / B), price-to-earnings (P / E), price-to-free cashflow (P / FCF) and enterprise value-to-EBITDA (EV / EBITDA). The portfolios are constructed by taking the top 10% of the stock universes and are rebalanced monthly. Only stocks with market capitalizations of larger than $1 billion are considered and 10 basis points of costs per transaction are included.
US Value Portfolios: Metric Comparison
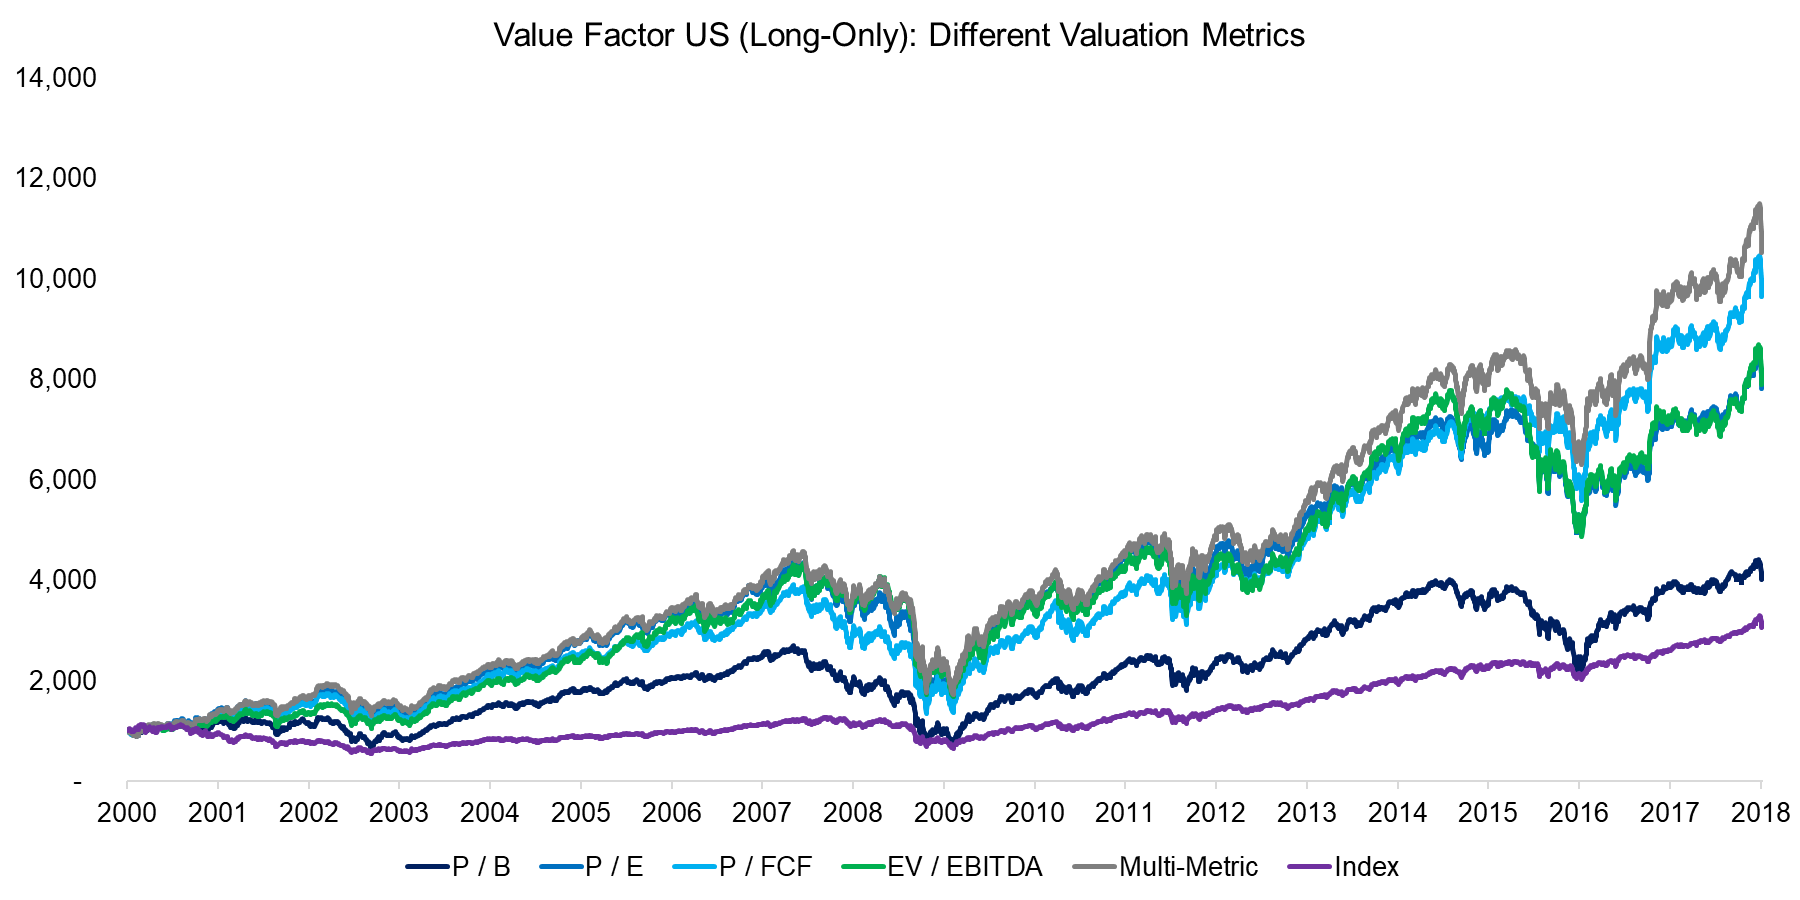
The chart below shows the comparison of different metrics for value portfolios in the US for the period from 2000 to 2018. We can observe that all portfolios outperformed the market over that time period, which can be explained by the period from 2000 to 2003, where the Tech bubble imploded and cheap stocks significantly outperformed the index.
The analysis highlights that the price-to-book portfolio generated the lowest performance, which likely indicates that in the US this metric has been inferior for identifying cheap companies compared to others. Modern finance focuses more on earnings and cashflow than book values, which rarely reflect the intrinsic value of company, e.g. technology companies tend to have few tangible assets. The multi-metric portfolio, which ranks stocks for all four metrics simultaneously, generated the strongest performance.
Source: FactorResearch. The results are hypothetical results and are NOT an indicator of future results and do NOT represent returns that any investor actually attained. Indexes are unmanaged, do not reflect management or trading fees, and one cannot invest directly in an index.
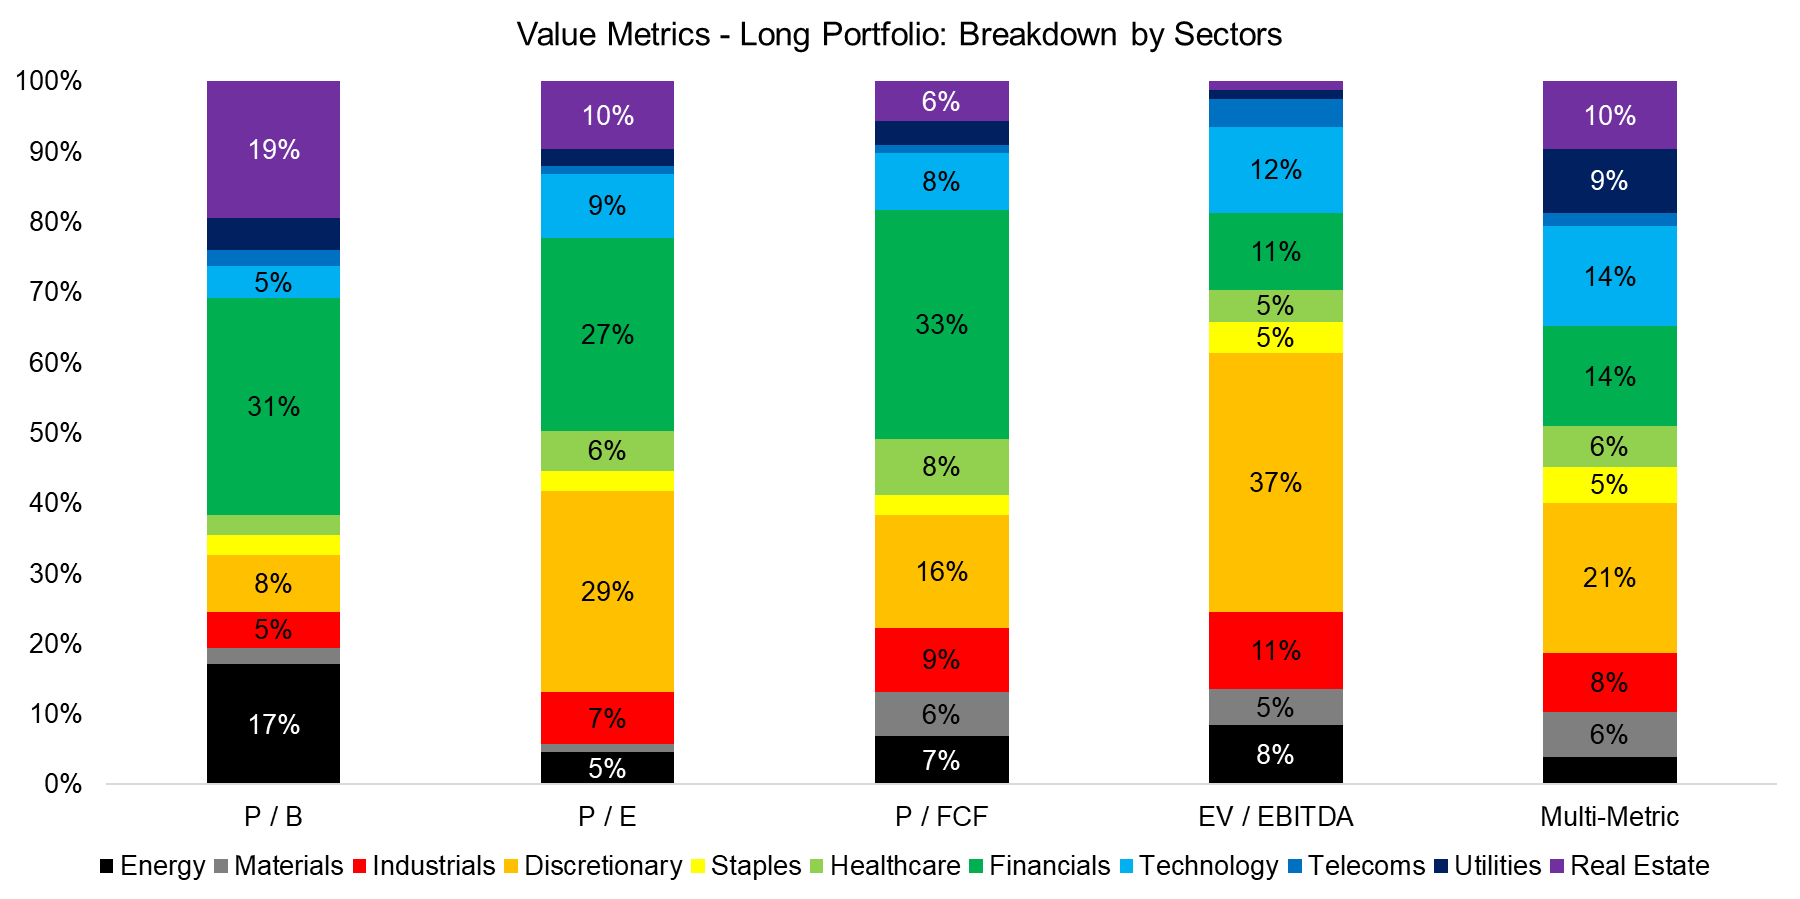
It is worth highlighting that the valuation metrics lead to different portfolios from a sector perspective. For example, EBITDA (earnings before interest, depreciation and amortization) is not a meaningful measure for banks, as their major source of income is interest, which means they are excluded from the EV / EBITDA portfolio (other financial companies, like asset managers, which have fee income are included).
US Value Portfolios: Breakdown by Sectors
The chart below shows the long portfolio for the different valuation metrics and we can observe that there are sectoral biases towards the Financial and Consumer Discretionary sectors, i.e. these sectors are cheap across metrics. Interestingly, the multi-metric portfolio is most diversified across sectors.
European Value Portfolios: Metric Comparison
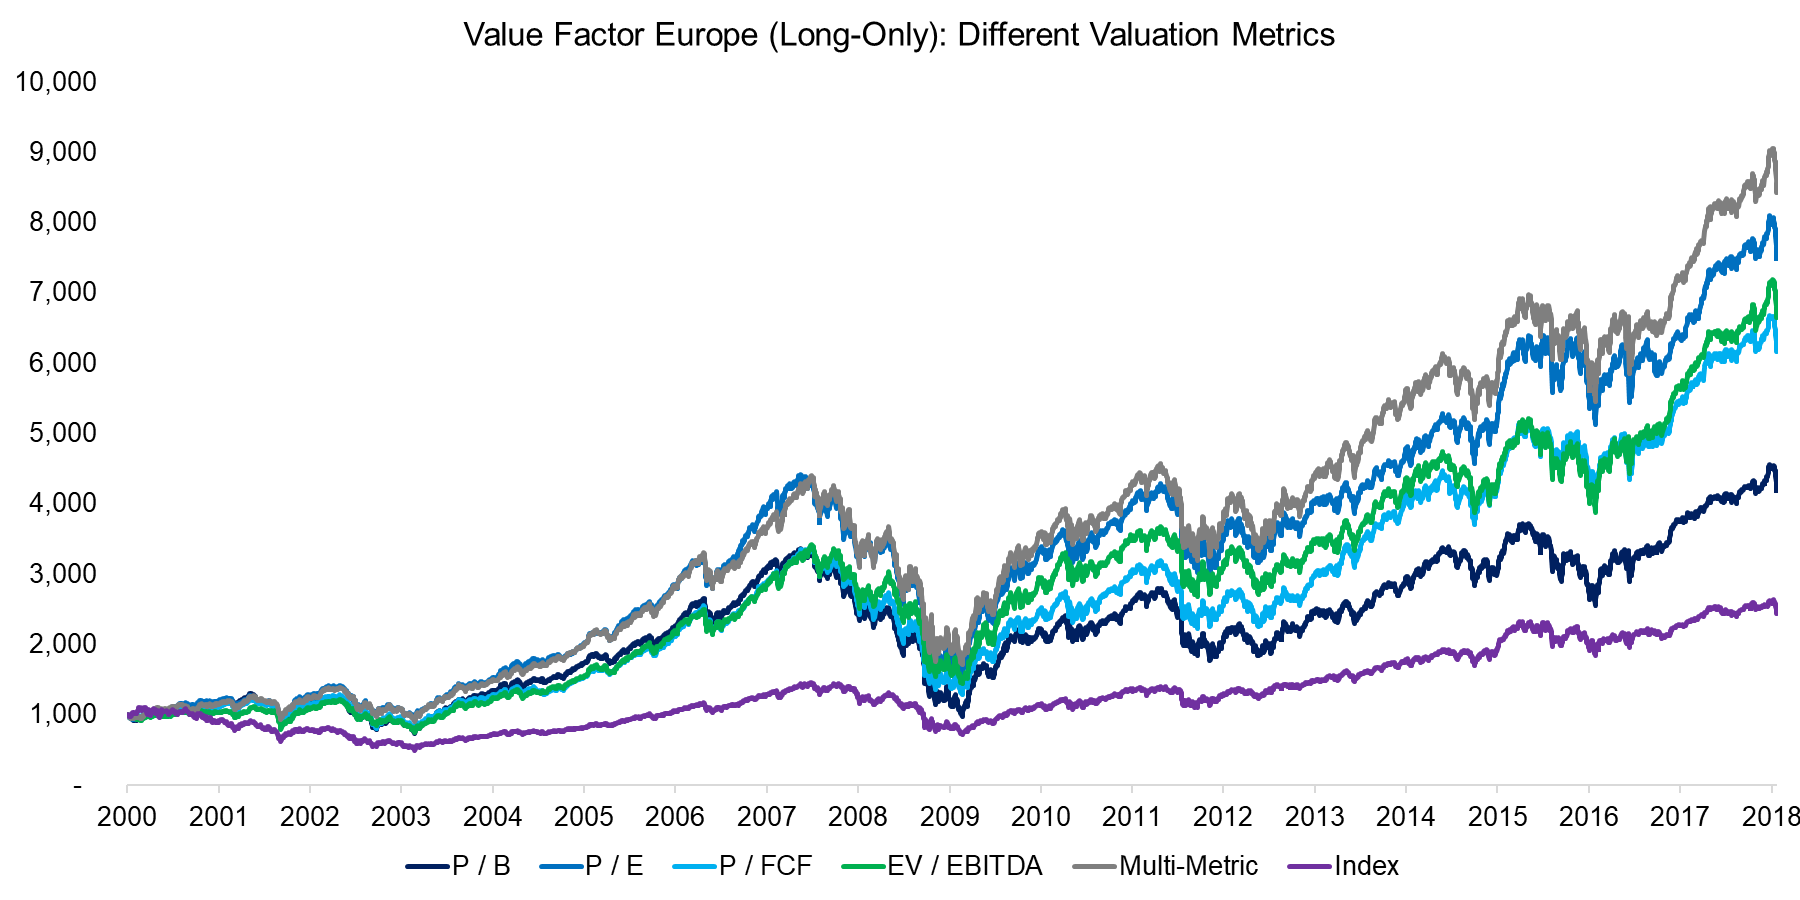
Similar to the US, value portfolios in Europe outperformed the market since 2000, but also due to the strong performance of cheap stocks after the Tech bubble implosion. If the data was rebalanced at a later date, then the outperformance would be far less significant. Price-to-book has also been a less effective value metric in Europe while the multi-metric approach generated the strongest performance.
Source: FactorResearch. The results are hypothetical results and are NOT an indicator of future results and do NOT represent returns that any investor actually attained. Indexes are unmanaged, do not reflect management or trading fees, and one cannot invest directly in an index.
Japanese Value Portfolios: Metric Comparison
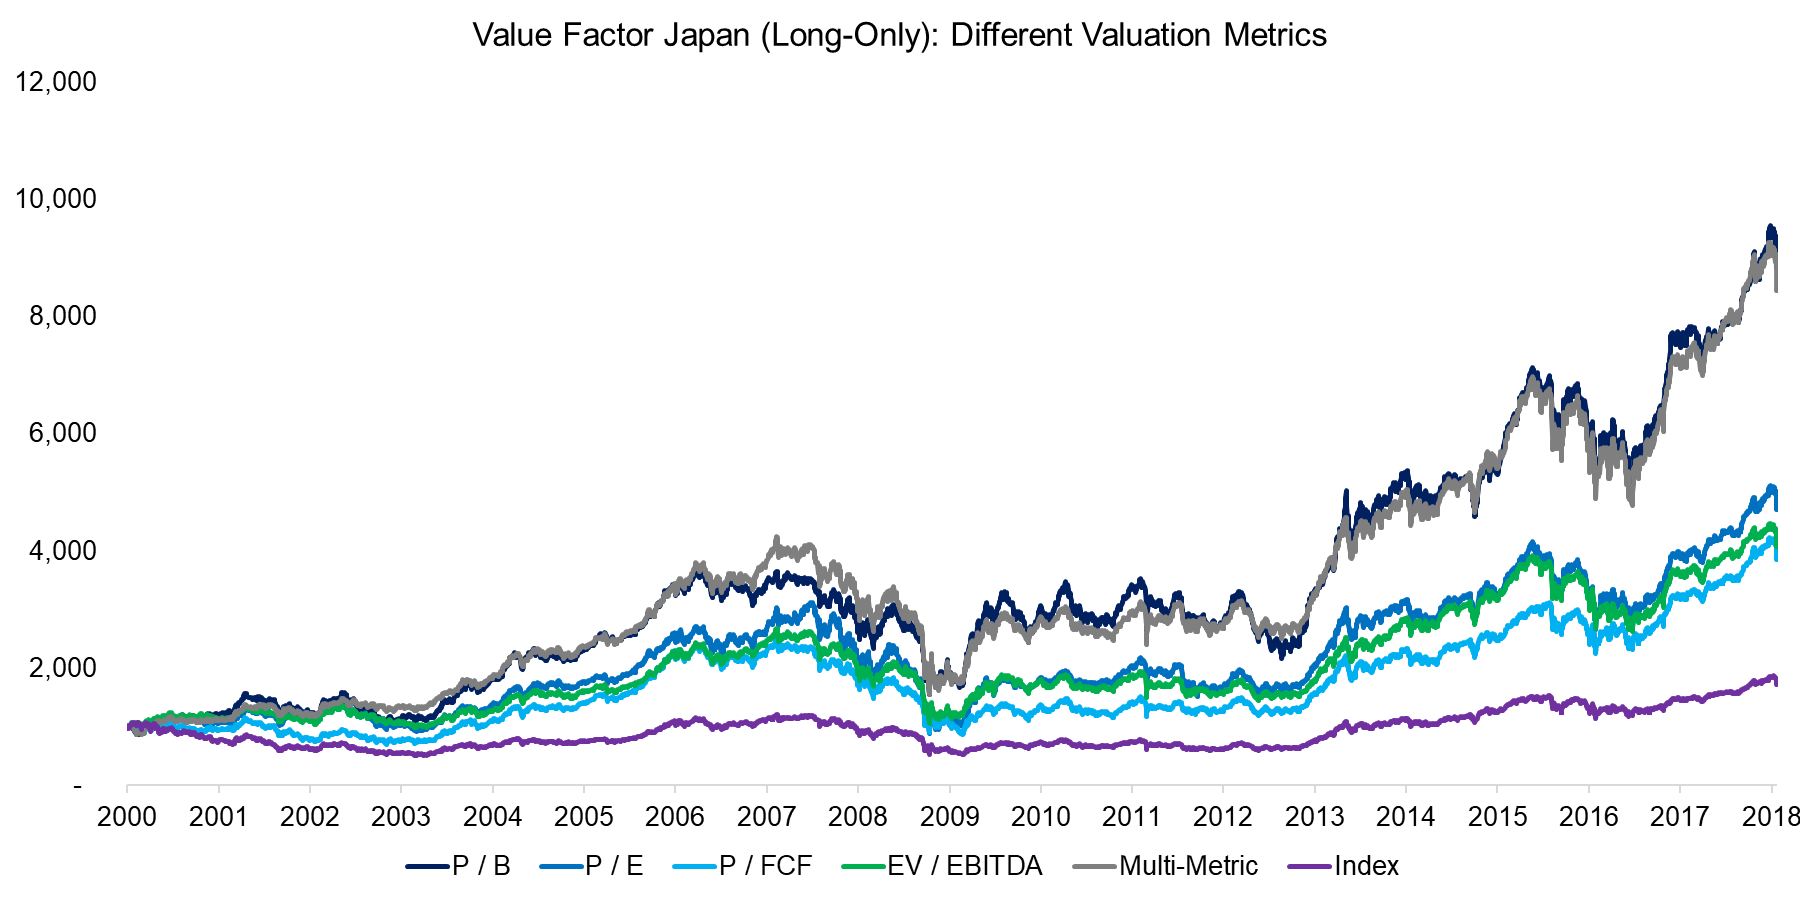
Japan is often considered an anomaly for quantitative strategies (especially momentum), but the value factor overall mirrors the performance of the global value factor. Similar to the US and Europe, cheap stocks outperformed the market; however, in contrast, the price-to-book portfolio generated the highest returns. It is somewhat challenging to explain, from an accounting perspective, why price-to-book would be a superior metric in Japan, as many listed companies have adopted IFRS and Japanese GAAP is relatively comparable to global accounting standards. Perhaps this reflects historical preferences of the investor and analyst community, although this might change given the continuous integration of global capital markets.
Source: FactorResearch. The results are hypothetical results and are NOT an indicator of future results and do NOT represent returns that any investor actually attained. Indexes are unmanaged, do not reflect management or trading fees, and one cannot invest directly in an index.
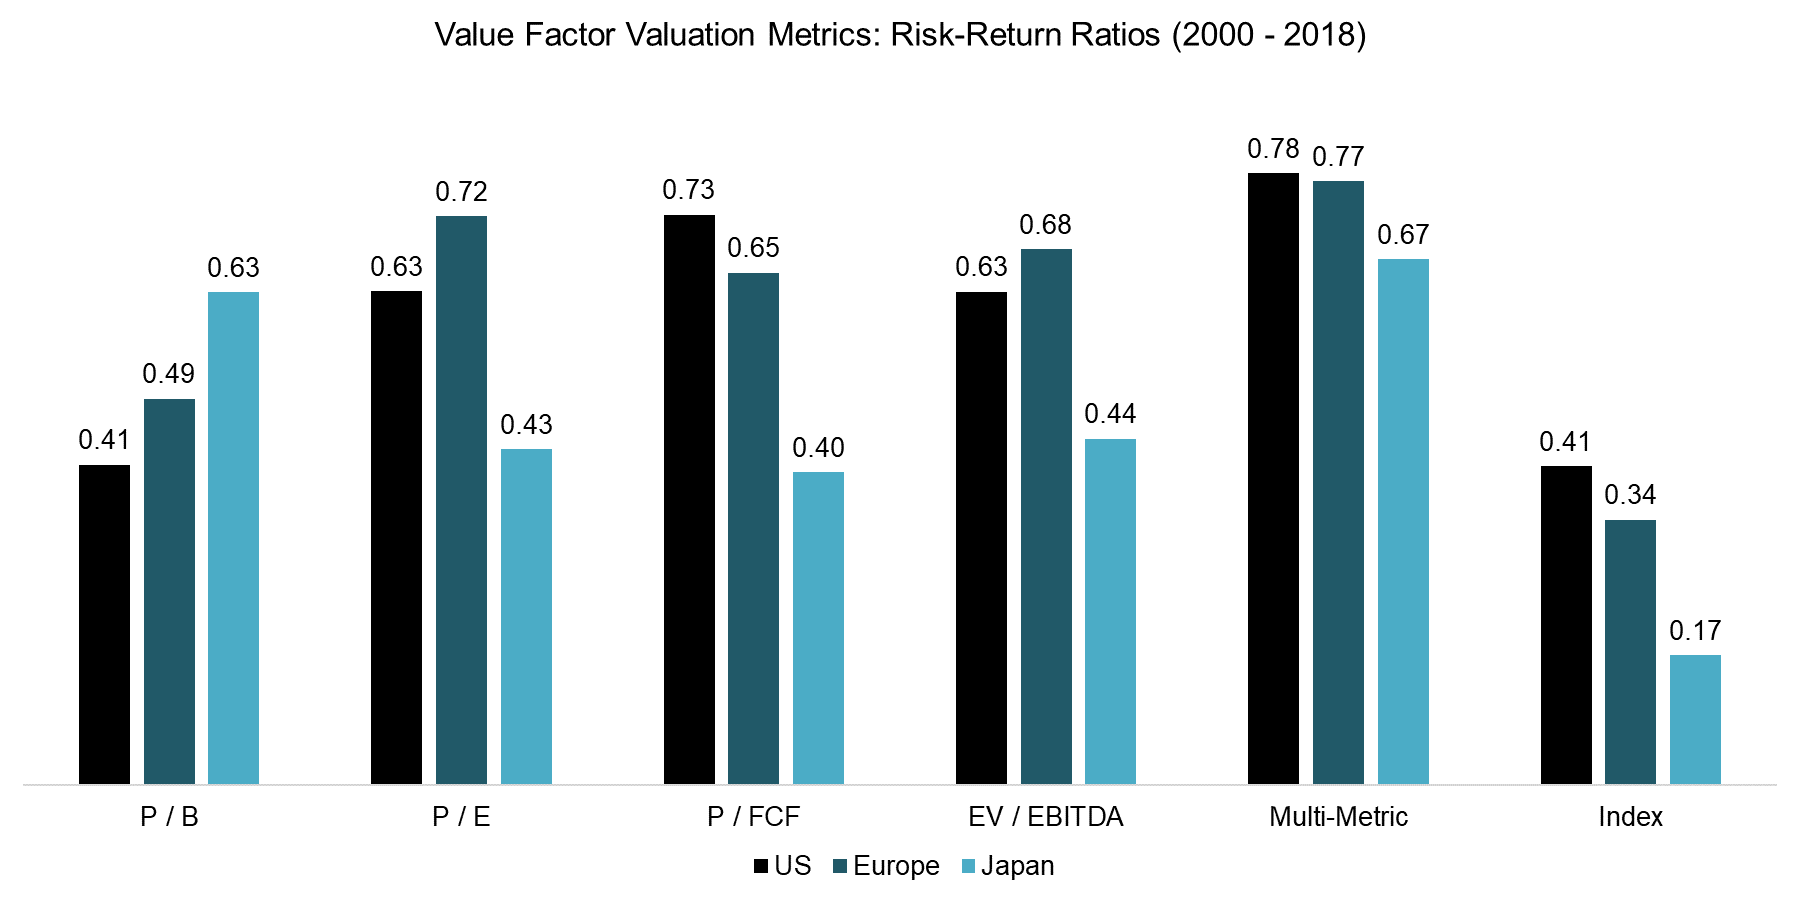
Value Portfolio Metrics: Risk-Return Ratios
In addition to showing the raw performance of the various metrics, we can also analyze the risk-return ratios, which are displayed in the chart below. Overall there does not seem to be one metric that is consistently superior across regions. Selecting the best performing metric for each region could be challenged as optimization, unless there is a sound economic explanation, e.g. unique investor behavior in certain markets. Given similar accounting rules and a global financial community, this is unlikely (although there are arguments for the “single-factor” value metric when it comes to enterprise multiples, see here, here, and here).
However, investors can mitigate value metric selection risk by combining different metrics. One possible explanation for the superior results of the multi-metric approach is that it avoids false positives, e.g. stocks that appear as value stocks on a single metric for accounting reasons but would not be considered value stocks on other valuation metrics. This ensemble approach shows attractive risk-return ratios across regions.
Source: FactorResearch. The results are hypothetical results and are NOT an indicator of future results and do NOT represent returns that any investor actually attained. Indexes are unmanaged, do not reflect management or trading fees, and one cannot invest directly in an index.
Further Thoughts
This research note highlights some of the choices investors have when defining value stocks. Value isn’t necessarily dead — it all depends on how you measure it, when and where it is measured. This inconsistency suggests that value is merely “noisy,” which is well-established. Moreover, the inconsistent performance of the valuation metrics across regions is somewhat surprising, but might be mitigated via a multi-metric approach. However, although combining multiple valuation metrics has generated relatively more attractive results across regions, the value factor performance was flat over the last 10 years. Naturally, investors can diversify across factors by creating multi-factor portfolios, allowing them to harvest returns from a variety of risk premia sources (please see our report: Intersectional Model: Sorting by 7 Factors).(1)

References[+]
| ↑1 | Long short results are posted below.
A few key highlights between the long-only and the long/short analysis:
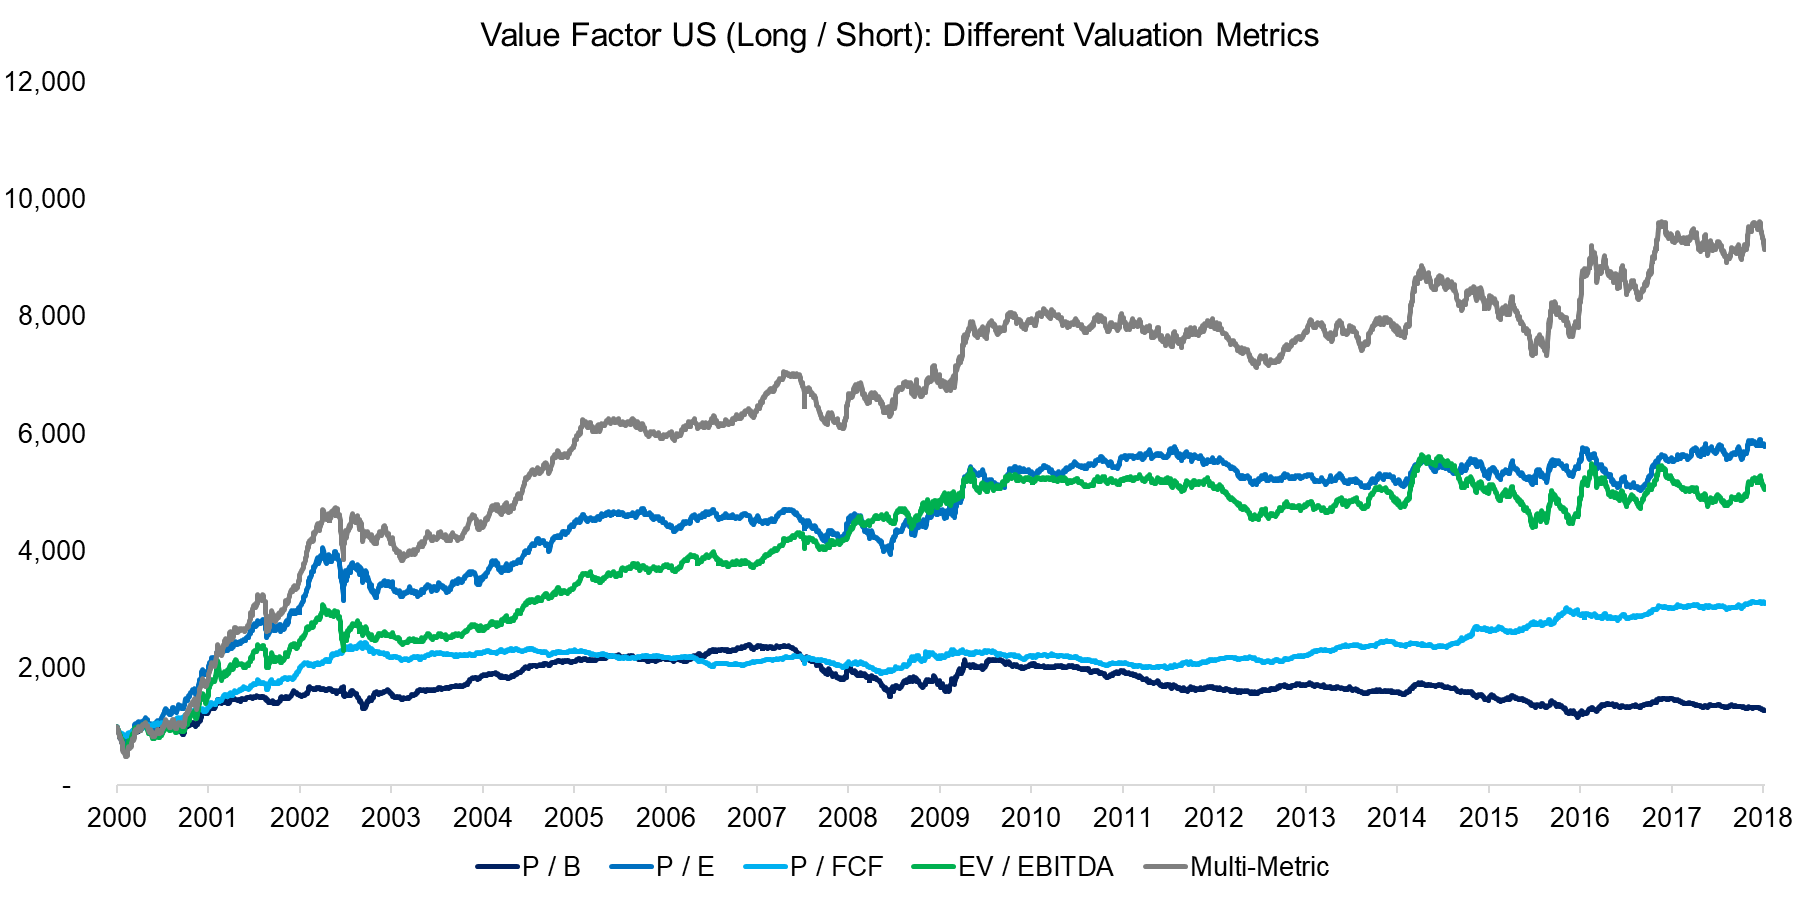
US Long/Short
European Long/Short 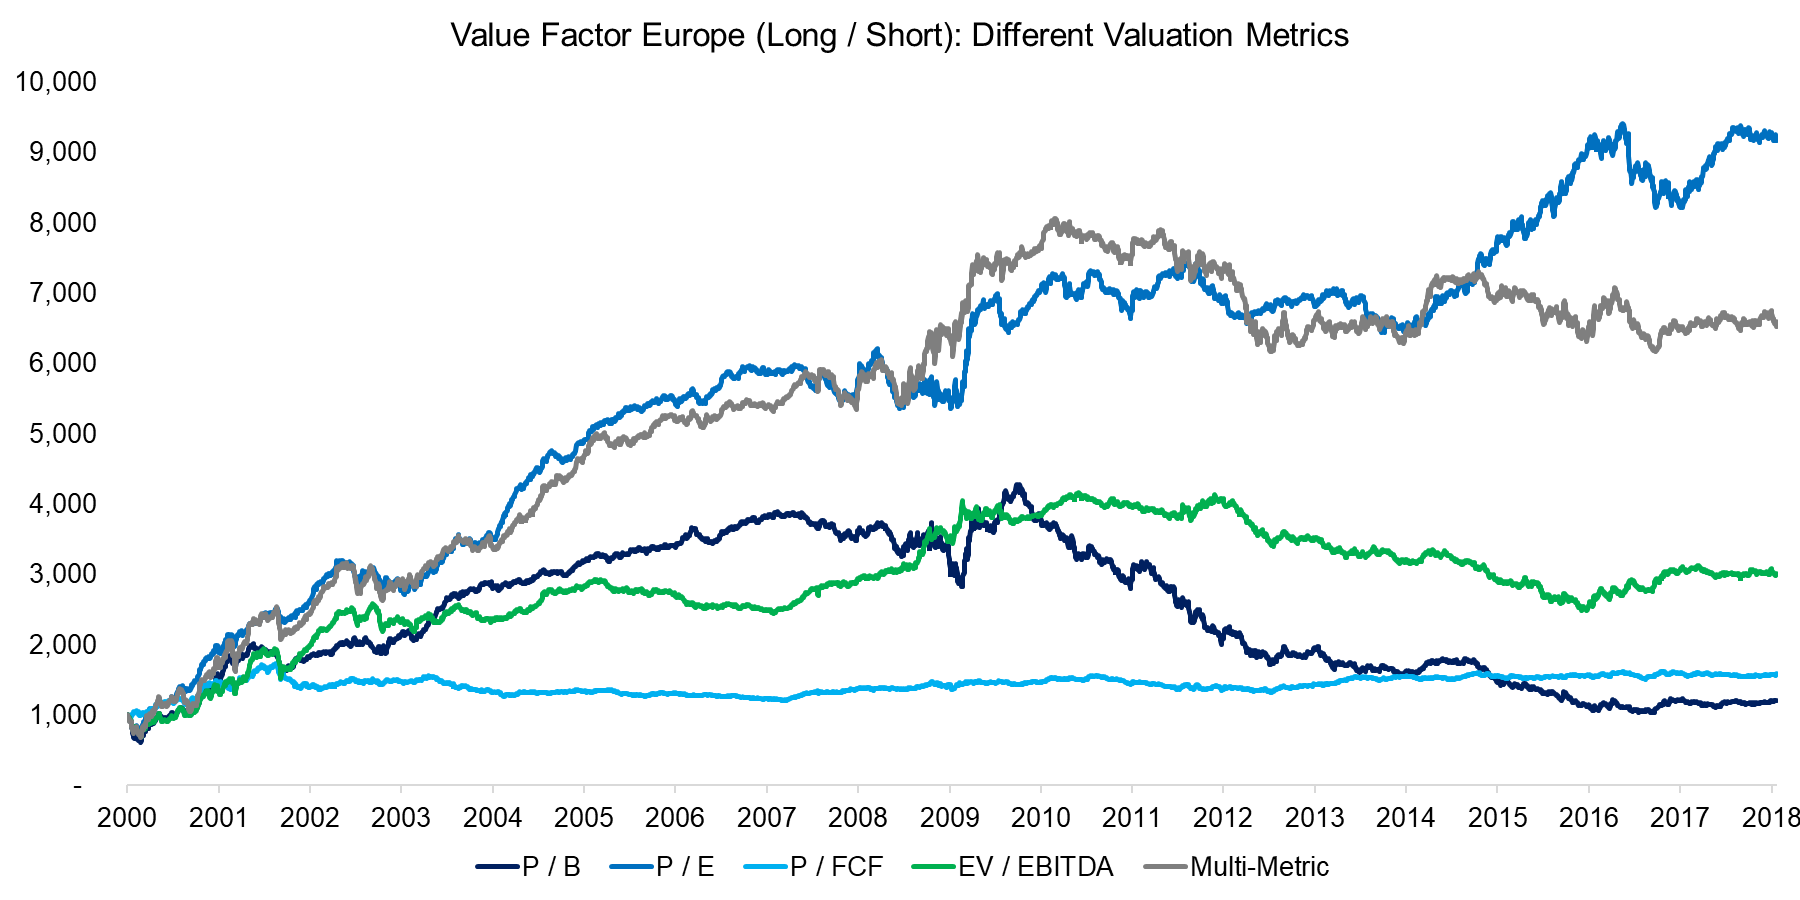 Source: FactorResearch. The results are hypothetical results and are NOT an indicator of future results and do NOT represent returns that any investor actually attained. Indexes are unmanaged, do not reflect management or trading fees, and one cannot invest directly in an index. Japanese Long/Short  Source: FactorResearch. The results are hypothetical results and are NOT an indicator of future results and do NOT represent returns that any investor actually attained. Indexes are unmanaged, do not reflect management or trading fees, and one cannot invest directly in an index. Long-Only Results Post the Global Financial Crisis The charts below show the long-only value portfolios rebased in 2010, i.e. post the Global Financial Crisis. The results highlight that there isn’t one single superior valuation metric, but that the multi-metric approach is likely the best approach. We can also observe that the difference between the value portfolios and the indices across regions are much narrower than in the analysis from 2000, which highlights that many value portfolios did not generate positive excess returns over the last decade. US Value Portfolios Since 2010: Metric Comparison 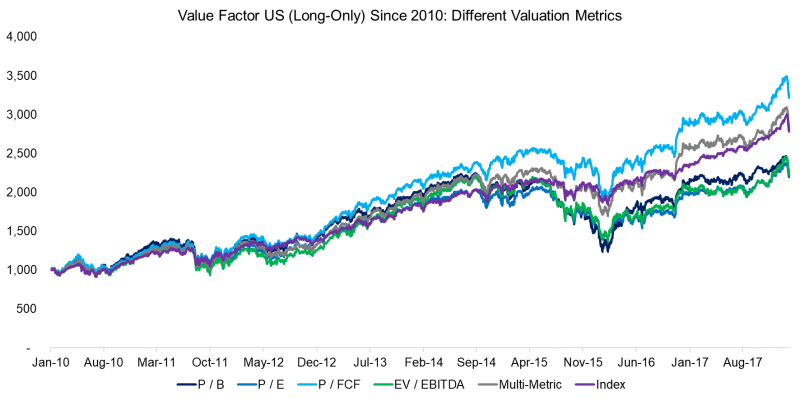 Source: FactorResearch. The results are hypothetical results and are NOT an indicator of future results and do NOT represent returns that any investor actually attained. Indexes are unmanaged, do not reflect management or trading fees, and one cannot invest directly in an index. European Value Portfolios Since 2010: Metric Comparison 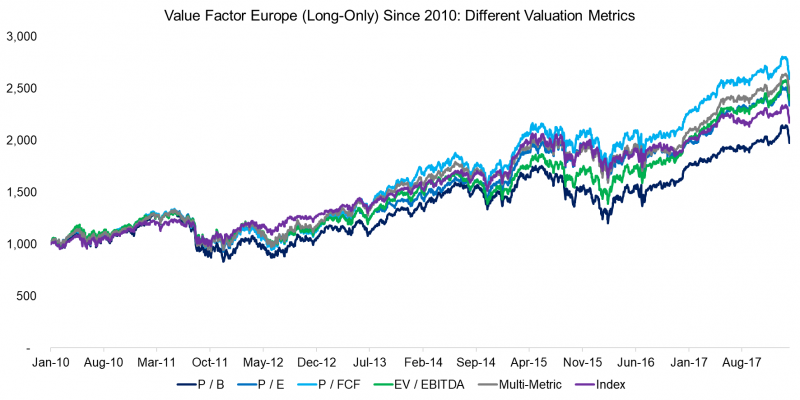 Source: FactorResearch. The results are hypothetical results and are NOT an indicator of future results and do NOT represent returns that any investor actually attained. Indexes are unmanaged, do not reflect management or trading fees, and one cannot invest directly in an index. Japanese Value Portfolios Since 2010: Metric Comparison 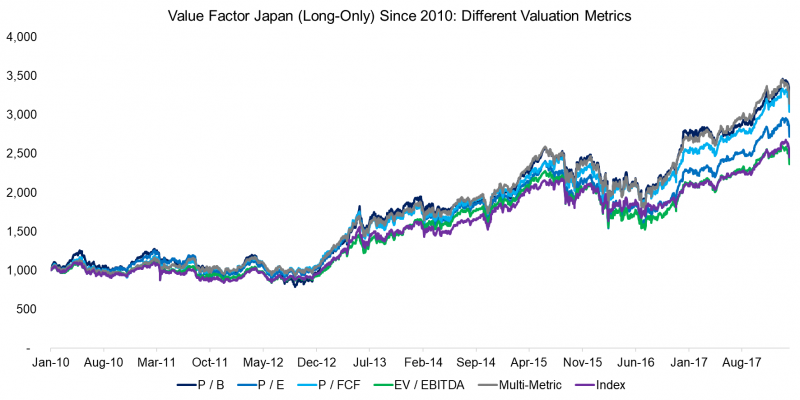 Source: FactorResearch. The results are hypothetical results and are NOT an indicator of future results and do NOT represent returns that any investor actually attained. Indexes are unmanaged, do not reflect management or trading fees, and one cannot invest directly in an index. |
|---|
About the Author: Nicolas Rabener
—
Important Disclosures
For informational and educational purposes only and should not be construed as specific investment, accounting, legal, or tax advice. Certain information is deemed to be reliable, but its accuracy and completeness cannot be guaranteed. Third party information may become outdated or otherwise superseded without notice. Neither the Securities and Exchange Commission (SEC) nor any other federal or state agency has approved, determined the accuracy, or confirmed the adequacy of this article.
The views and opinions expressed herein are those of the author and do not necessarily reflect the views of Alpha Architect, its affiliates or its employees. Our full disclosures are available here. Definitions of common statistics used in our analysis are available here (towards the bottom).
Join thousands of other readers and subscribe to our blog.