Warren Buffett sold long-dated, deep out of the money puts in the years leading up to the financial crisis. In his 2008 Annual Letter to Shareholders, he explained:
I believe each contract we own was mispriced at inception, sometimes dramatically so.
He goes on later to claim:
…If the [Black-Scholes option pricing] formula is applied to extended time periods…it can produce absurd results.
To make his point, he uses an extreme example of a 100 year put to support his statement. He goes on to explain that the volatility of outcomes for stocks a hundred years from now is very different than those considered in the Black-Scholes formula (which predict a much larger left tail).
I think he’s wrong. Except…he’s Warren and his options were unique.
With the help of Robert McDonald, the Gaylord Freeman Distinguished Chair in Banking Professor of Finance at Kellogg and author of Fundamentals of Derivatives Markets and John Watrous, Co-founder of the derivatives trading firm Chicago Trading Company (CTC), I will explain both why I’m willing to call out Warren Buffett and concede that his agreement was unique.
In a follow-up article, I will argue that the same themes of incorporating probabilities and risk (including that of insolvency) is pertinent to all investors, especially those that are committed to rebalancing their portfolios. In both, I’ll try and keep the option math to a minimum, but I do need to first review the basics of option pricing and risk management.
Put Options Explained
Put options (or simply “puts”) allow the buyer to “put back” an asset to the seller at an agreed upon date and price. In this way, puts are like insurance. An investor who may want to own the S&P 500 ETF but can’t stomach a drop of more than 20% can buy the ETF and buy a put that gives her the right to sell the ETF 20% lower (net costs). That price level which limits the loss to 20% is called “the floor”. Few investors buy insurance like this once they find out the price of the puts. As of the end of November, put options on the ETF designed to limit after cost losses at 20% for a bit less than a year would cost roughly 2.4% of the overall ETF position.(1)
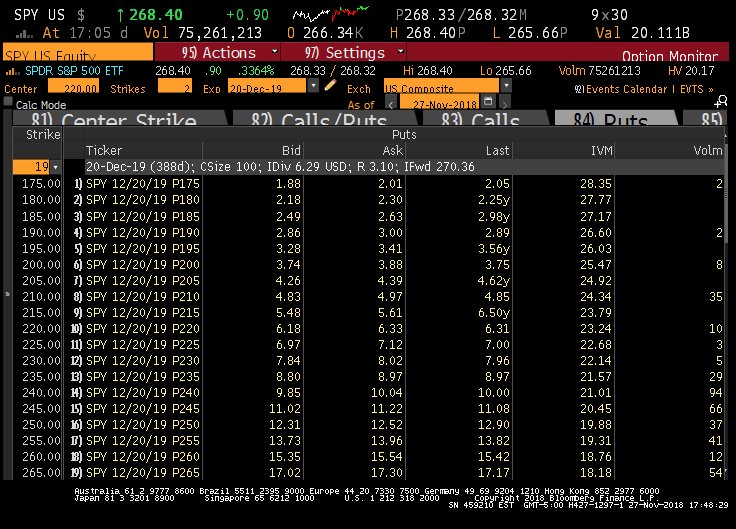
The S&P 500 ETF SPY’s price on November 27th was 268.4. The floor protecting against a drop of more than 20% would imply a level of roughly 215 with a price of roughly 5.61. Factoring in that cost would imply a payoff starting at closer to 220. That cost of roughly 6.33 or 2.4% of 268.
Some readers might wonder why the nervous investor wouldn’t simply include a “costless” stop order, an order to sell once the price dropped 20%. As enticing as this solution sounds, option traders realize the high cost of executing those orders accurately in a fluctuating market. Buying hedges when the market ticks up and selling when it ticks down, quickly chews up profitability especially given that the largest moves are typically overnight and often gap in price. A band of options traders on exchanges like the Chicago Board of Trade ensures this cost of hedging is priced accuracy.
If in our example the price of the put was too high, options traders could replicate the put’s value by “delta hedging”, fancy slang for selling or buying portions of the underlying asset in tandem with the probability-weighted discounted future payoffs of the put. “Portfolio Insurance”, for example, was marketed in the early to mid-80s as a dynamic hedging technique that was a cheaper alternative to buying insurance against a drop through a put. The problem occurred as traders, trying to hedge this put-like insurance, sold in larger and larger amounts as the corresponding probability of the insurance paying off increased. The crash of 1987 was the result, and few were able to get out at the promised floor. The carnage was a stark reminder of how real these hedging costs can be.
Option Pricing and the Black-Scholes Model
If possible, an investor or trader valuing an option would take the probability of the payoff happening, multiply it by the future value of the payoff, and discount that future value back to a present value. The problem is that we know neither the true probability nor the asset’s future discount rate, the compensation for both the risk (the risk premium) and the delay (the risk-free rate). Solving this riddle was the brilliance behind the Black-Scholes Option Pricing Model and led to a joint Nobel Prize in Economics for both Merton Miller and Myron Scholes in 1997 (Fischer Black was deceased and unable to receive the Prize).
Their mathematical breakthrough showed that practitioners could arrive at the same answer for pricing an option as if they knew the true probability and discount rate by simply assuming a risk-neutral world, a world where investors demanded no additional premium for risk.(2) In this make-believe world, the discount rate would be the risk-free rate out to the maturity of the option and the underlying volatility of the asset would determine the probability of the option’s payoff. The array of future potential values of the asset would be distributed nicely over a bell-shaped normal distribution centered around the forward price. If the market was efficient, even though the forward price was much lower than the true market’s expectation, the use of a much lower risk-free discount rate than the true discount rate negated the discrepancy. Magic.
Black-Scholes did still require some assumptions about future volatility and dividend payments (not buybacks!), but it is now otherwise universally accepted as the bedrock of option pricing, at least by everyone but Warren Buffett. As Warren explains in his 2008 Letter to Shareholders (published in early 2009):
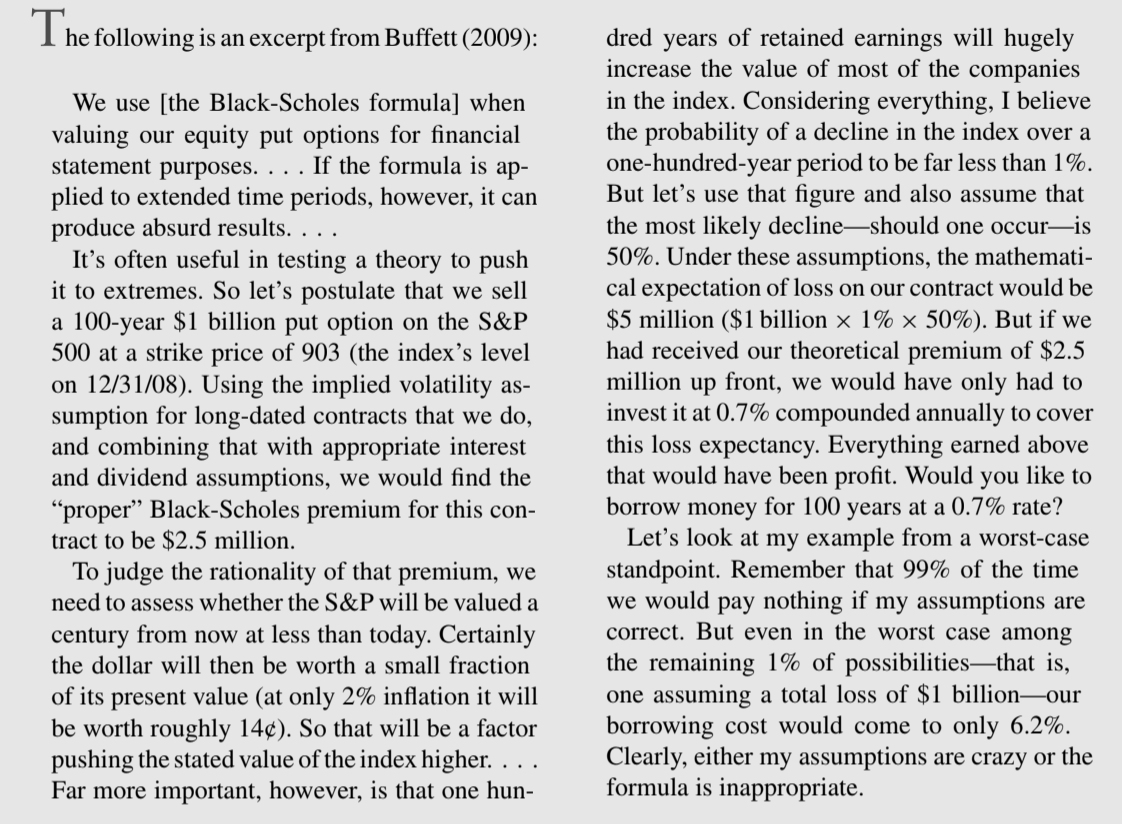
Warren’s assumptions aren’t crazy. In fact, they seem to be pretty accurate. As Robert McDonald derives in the 22nd Chapter of his 3rd addition of Derivatives Markets, a 100 year put for $1bn assuming 20% volatility, a long-term risk free rate of 4.4% and a dividend rate of 1.5% implies a Black-Scholes put price of $2,412,997, close to Buffett’s $2.5 million.
But Warren isn’t discussing risk-neutral probabilities, those assumed in Black-Scholes and imputed by volatility assumptions. He’s evaluating the model’s probabilities as if they were real, actual probabilities. If we, (really Robert McDonald),
Buffett also assumes that the expected loss on the index, conditional on the index under-performing bonds, will be 50%. This again is a statement about the real world, not a risk-neutral world, distribution. With an 8.4% expected return on the market, the implied expectation of $1 billion of the index conditional on the market ending below where it started is $596,452,294, or 59.6% of the current index value. Again, this is close to Buffett’s assumption of 50%.
The probability and value of the index conditional on the index being below the put’s floor value are presented in the table below for a variety of assumed risk premiums.
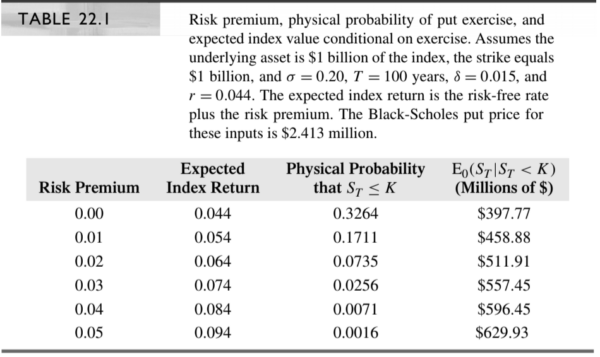
Given the other assumed Black-Scholes inputs, Buffett’s statements about the likely future behavior of the index correspond rather nicely to a 4% equity risk premium and the total discount rate for stocks is 8.4%. Note that the risk-neutral probability where the risk premium is zero of the market being below its starting value in 100 years is closer to 33%! This huge gap reflects the difference of earning 4.4% versus 8.4% over 100 years. It does not reflect, as Buffett argues, an inappropriate use of volatility to back into a true probability. The 33% probability is a pseudo-probability that is true only in a risk-neutral world.(3)
Sorry, Warren.
Except…Warren’s options are unique to him and Berkshire Hathaway in that he included a clause that he would never have to post collateral. Seriously. His bet is largely riskless to him in that he wouldn’t have to pay a dime until maturity regardless of the outcome, including Armageddon.
Buffett’s Risk-Free Borrowing Rate
Any buyer of a put needs to be assured the seller eventually pays (i.e., no counterparty risk!). This is typically accomplished by demanding the seller posts collateral or that the trade takes place on a well-regulated exchange whose members post daily collateral. As the potential pay-off becomes larger, the seller posts more collateral. The buyers of the puts sold by Buffett made an exception for Berkshire Hathaway.
Warren negotiated that his firm would never be forced to post collateral. He would only have to come out of pocket at maturity, between 2019 and 2028 (p. 19), when he would be a spry 89 to 98 years old. As such, the put acts as a loan to Berkshire which gets larger and larger as the market drops. In effect, he negotiated to borrow an indeterminate amount of money at the risk-free rate and add to his already leveraged bet on the stock market (estimated as 1.7 to one on average by (4)).(5)
Guns and Butter
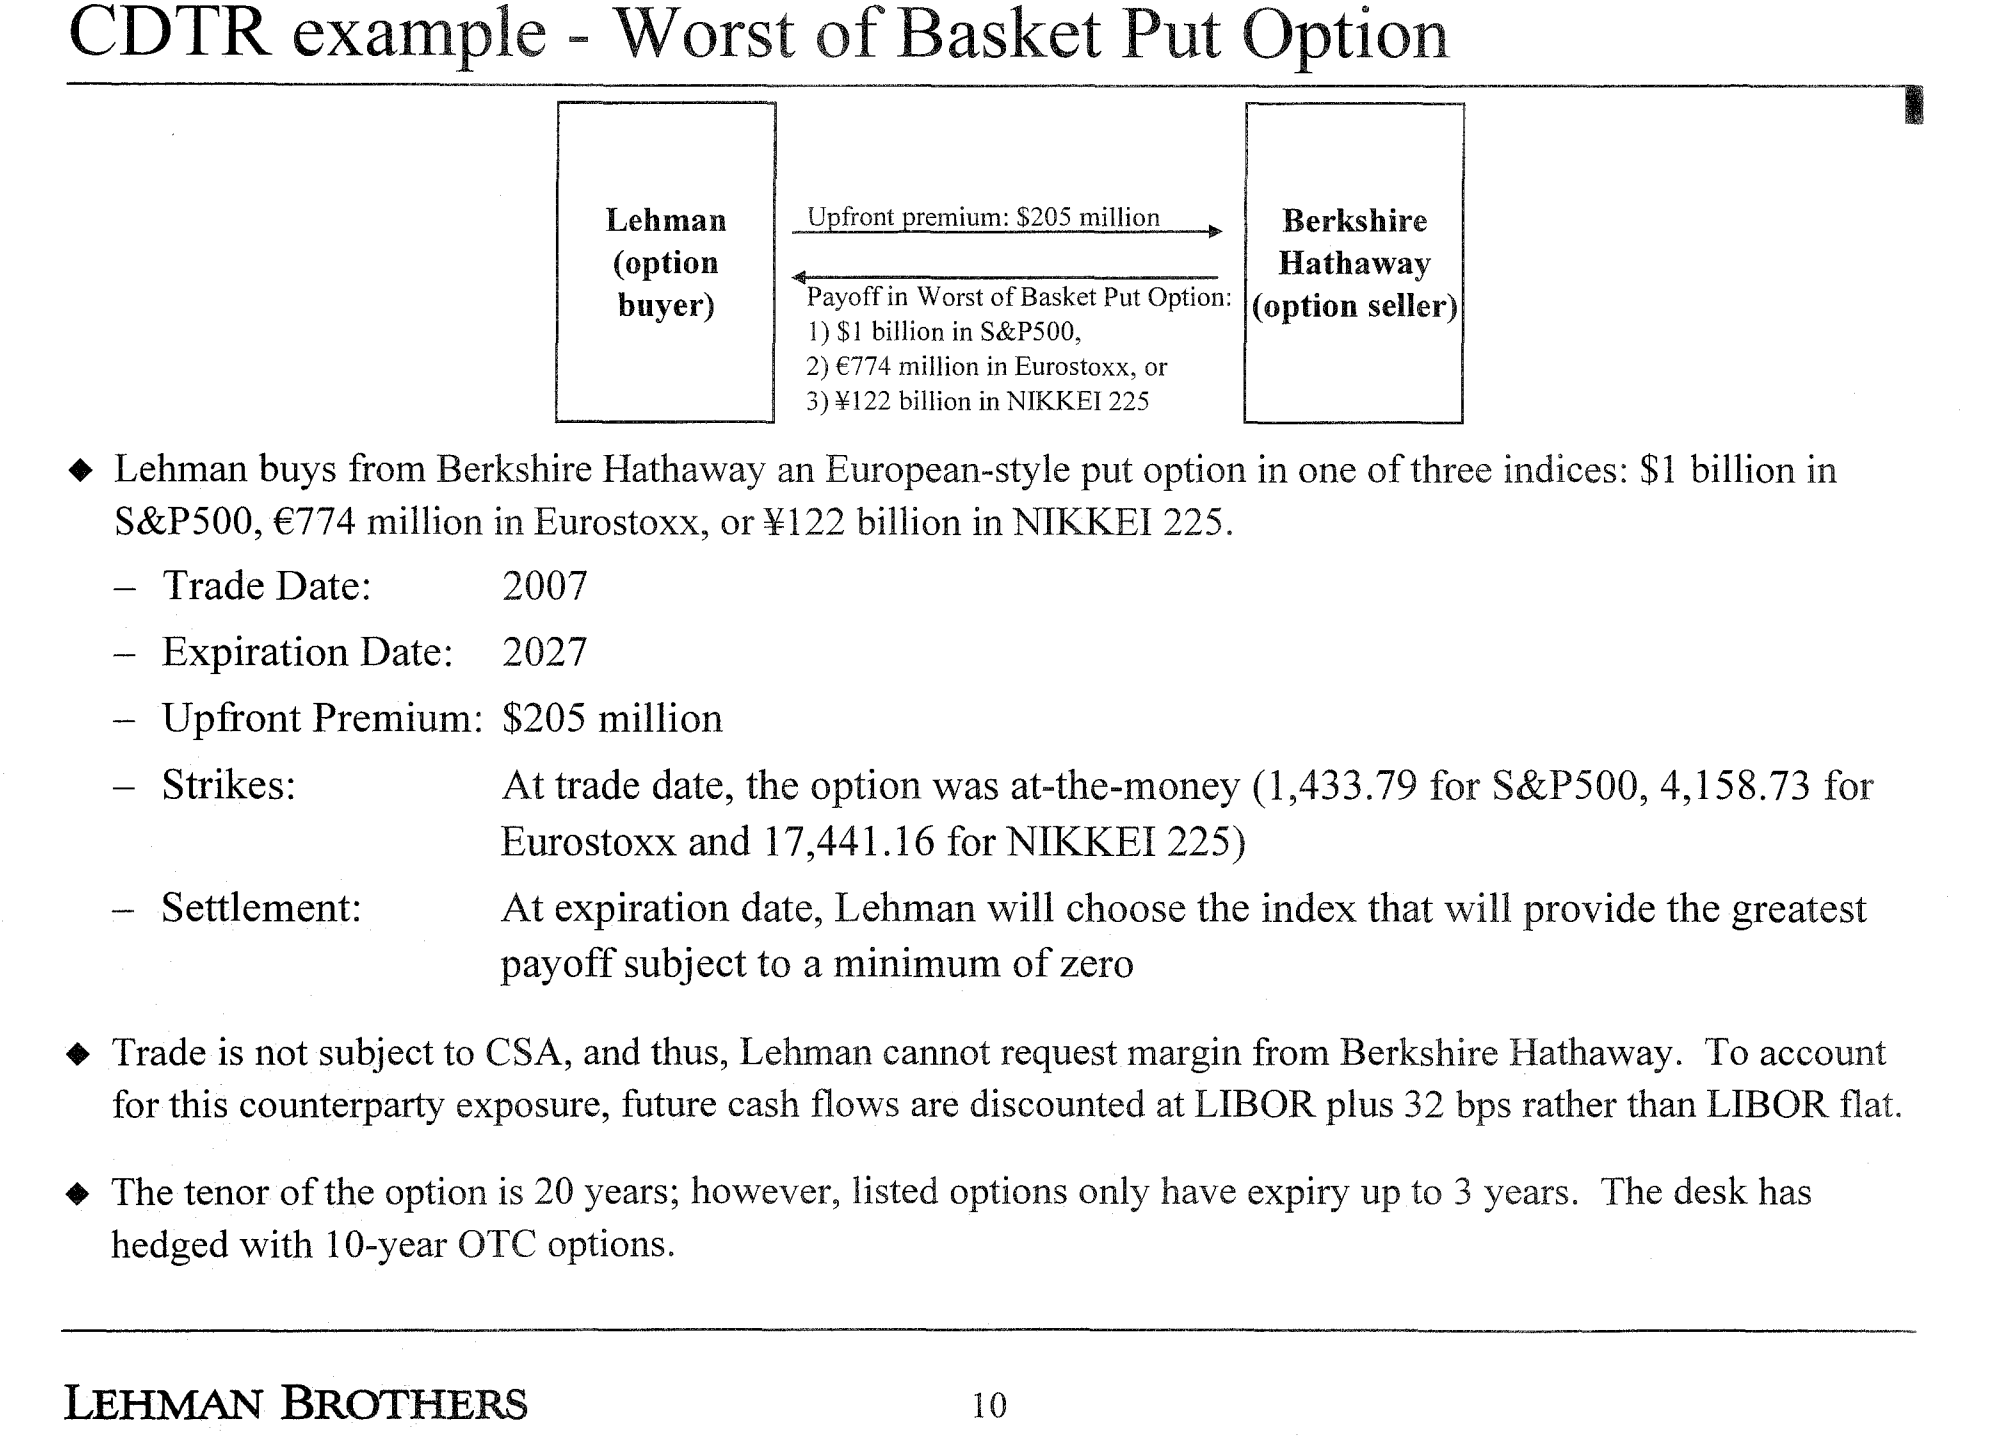
When Buffett was making his put trades I worked for Credit Suisse, one of the many Berkshire’s counterparties. Although I was only tangentially involved, I can attest we high-fived after buying the puts. Lehman Brothers did as well, as witnessed by this memo outlining their trade (much more exotic than but applicable to a simple put) and resulting in $16.5mm of immediate profit.(6)
If Warren Buffett hoodwinked the banks that bought the protection by refusing to post collateral, why did the sellers view the trades as so profitable? These bankers were anything but dumb.
The expression “guns and butter” simplifies the stark economic trade-offs countries make in war, but we also used the term in the depths of the crisis to describe what we might be trading in the future if things got much worse. Risk managers know intuitively that they can’t prepare for all disasters, nor should they. At some point, the game is over. It is futile (and expensive!) to hedge out the risk of Armageddon.(7)
Although it’s impossible to know, my guess is that risk management teams at many of the banks that entered into those trades did the same mental calculation discounting Armageddon. If Berkshire goes down, they may have reasoned, our bank is probably toast, too. Plus, they approved loans all the time (just not those that could potentially grow so large).
They may neither have known the magnitude of the similar large trades at other firms nor estimated the eventual expense of hedging this risk. In fact, as those other trades were revealed and their exposure grew, they may have in fact tried to hedge. (as witnessed by the price of protection via Berkshire CDS spiking to nearly 500 in the closing days of 2008 and early 2009.)
Lesson to Learn and Not Learn
Warren Buffet sold put options through Berkshire Hathaway with the mistaken idea that he was betting against the probabilities inherent in the Black-Scholes Model. His brilliance was demonstrated in his ability to negotiate a contract where he wouldn’t have to recognize his potential losses until he was into his 90s. His faith in the resilience of most of the world’s major stocks markets is admirable and has made him an even wealthier man.
Of course, we will never hear the praise of his Japanese long-term investing counterpart who is still down nearly 20% in the Nikkei 225 Index since the end of 1989. Nor is the investor who was long the Russian stock market in 1917 or the Chinese market in 1947 famous. But any buyer of put options on those markets at the time wouldn’t likely have been much better off either. At that stage, there was no point to hedge.
The Black-Scholes Model doesn’t say anything about the probabilities of those catastrophic risks. It does, though, help us better price out the risk of protection and cost of leverage. Only for a few like Warren does being short options not come with some serious downside risk (see Optionseller.com as the latest casualty). For most of us, we should only increase our exposure to stocks with the knowledge we have other assets or time to balance the bet.
As we reflect back on the crisis from 10 years ago, we should spend less time applauding those like Warren because their situation may be much different from our own. We should also refrain from berating ourselves for not adding to equities in the depths of the crisis and mock models for failing to produce results they weren’t intended to give. I will save that discussion for Part 2.
References[+]
| ↑1 | And rightfully so. As the graph shows, put protection becomes relatively more expensive as measured by implied volatility. Ronen Israelov of AQR shows in his article “Pathetic Protection: The Elusive Benefits of Protective Puts” that the volatility risk premium embedded in puts negates much of their protective benefit. |
|---|---|
| ↑2 | Their result was based on the assumption of an arbitrage free world in terms of delta hedging, but for space purposes, I’m skipping that and their other assumptions. |
| ↑3 | Similar to the Black-Scholes model, the Expectations Hypothesis concerning the term structure of interest rates assumes a risk-neutral world. Long-term rates reflect expectations of short-term rates, but they also incorporate a risk-premium. When someone proclaims “the market expectations for future Fed moves” or some other similar blather, remember that we don’t know true market expectations without knowing the risk premium. |
| ↑4 | Frazzini et al, 2018. Frazzini, Andrea and Kabiller, David and Pedersen, Lasse Heje, Buffett’s Alpha (June 15, 2018). Financial Analysts Journal, Forthcoming. Available at SSRN: https://ssrn.com/abstract=3197185 or http://dx.doi.org/10.2139/ssrn.3197185 |
| ↑5 | Technically, he calculates in his 2008 letter that his max loss is $37.1 billion and more likely $9 billion. More, the buyers of the put, as shown in the Lehman example, did factor in enough profitability in the trade to adjust their future expected payoff back at a rate that included a small risk premium. |
| ↑6 | Note that Lehman discounted the expected discount rate at the risk-free rate plus the Credit Default Spread of Berkshire Hathaway although they don’t mention an actual CDS hedge. I’m guessing they simply wanted to reflect the reality that this was a loan to Berkshire and many loans by banks aren’t hedged (at least fully). As an aside, Berkshire used a 4% discount rate to value the puts at the end of 2008, 1.25% above prevailing interest rates, according to their 2009 Annual Report (p.84). I’m not sure how were able to justify that input to their auditors as it has no theoretical basis even when other liabilities were marked-to-market with higher discount rates. Another example on how it’s nice to be Warren. http://www.berkshirehathaway.com/2009ar/2009ar.pdf. |
| ↑7 | In fact, it may make sense to increase risk in Armageddon appears near. Lore on the CBOE is that on Monday morning following the Black Friday of October 1987, as the market continued its decent, a large options trader found himself so offsides that he knew he would be liquidated by the board at the close of the day. He couldn’t afford to get himself on sides. His reaction? He doubled down and became very wealthy when later in the day the market bounced back. |
About the Author: Jonathan Seed
—
Important Disclosures
For informational and educational purposes only and should not be construed as specific investment, accounting, legal, or tax advice. Certain information is deemed to be reliable, but its accuracy and completeness cannot be guaranteed. Third party information may become outdated or otherwise superseded without notice. Neither the Securities and Exchange Commission (SEC) nor any other federal or state agency has approved, determined the accuracy, or confirmed the adequacy of this article.
The views and opinions expressed herein are those of the author and do not necessarily reflect the views of Alpha Architect, its affiliates or its employees. Our full disclosures are available here. Definitions of common statistics used in our analysis are available here (towards the bottom).
Join thousands of other readers and subscribe to our blog.