What is the relationship between insider trades and anomalies?
- Anginer, Hoberg and Seyhun
- A version of the paper can be found here.
- Want to read our summaries of academic finance papers? Check out our Academic Research Insight category
What are the research questions?
Anomalies such as Value and Momentum have been exploited for years, yet the source of these premiums emerged as a major unresolved puzzle. Potential explanations can be grouped into two broad categories: “compensation for risk” or “mispricing”.
This paper studies this puzzle by investigating the relationship between insider trades and stock anomalies. Here’s a post about Insider trading pattern, from which we cite the definition of “Insiders”:
“Insiders” are broadly defined under SEC regulations to be those who have “access to non-public, material, insider information.” We perceive “Insiders” as more like officers who hold C-level positions in a company and usually can get access to information earlier than anyone else.
In other words, insiders are known as the investors best positioned to exploit mispricing of their own firm’s stock. This paper hypothesizes that if insider trades systematically predict the direction of returns due to anomalies, then it is likely that anomalies are due to mispricing/informational inefficiency.
To be specific, the paper examines the predictability of anomalies when insiders agree or disagree with the direction of returns implied by a given anomaly.
- AGREE: if i) insiders are ‘buyers’ of the stock and the anomaly signal predicts high returns, or ii) insiders are ‘sellers’ of the stock and the anomaly signal predicts low returns.
- DISAGREE: if i) insiders are ‘sellers’ of the stock and the anomaly signal predicts high returns, or ii) insiders are ‘buyers’ of the stock and the anomaly signal predicts low returns.
- NEUTRAL: if If insiders are not buyers or sellers.
The paper tests 13 anomalies:
- Post-earnings announcement drift (PEAD) — Livnat and Mendenhall (2006)
- Net operating assets — Hirshleifer, Hou, Teoh and Zhang (2004)
- Gross Profitability — Novy-Marx (2013)
- Return on assets —Fama and French (2008)
- Investment in assets — Titman, Wei, and Xie (2004)
- Assets growth — Cooper, Gulen, and Schill (2008)
- Book-to-market — Fama and French (1993)
- Net stock issuance — Pontiff and Woodgate (2008)
- Bankruptcy prediction scores (Ohlson’s O-Score) — Ohlson (1980)
- Accruals — Hirshleifer, Hou, Teoh, and Zhang (2004)
- Composite equity issuance — Daniel and Titman(2006)
- Size — Fama and French (1993)
- Momentum — Jegadeesh and Titman (1993)
What are the academic insights?
Using stock price data from CRSP, financial statement data from COMPUSTAT, and insider trading data from Thomson Reuters Insider Filing Data Feed (1996 to 2013) the research team quantitatively measured insider trading, creating an “Insider score.” Then it form portfolios for both time-series and cross-sectional analyses based on this score on a monthly basis.
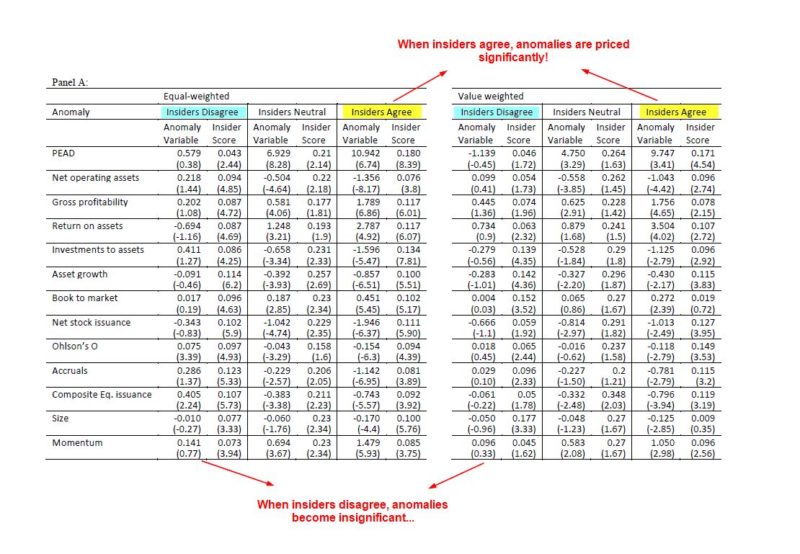
The table below shows the cross-sectional result:
- When insiders agree, anomalies are priced significantly.
- When insiders disagree, the predictive ability of the anomalies completely disappears! What’s more, 2 of the 13 anomalies switch signs.
As expected, the results are somewhat weaker when we value-weight the observations in the cross-sectional regressions. This is because insider trading is generally less informative for large firms.
The most important chart from the paper

Why does it matter?
The conclusion of this paper is that the information content of insider trading is what dominates the anomaly, which explains why the predictive ability of anomaly variables disappears when insider disagrees. The findings provide support for the mispricing explanation of why anomalies persist.
Abstract
Many studies show that future stock returns are predictable. These findings are consistent with either mispricing or risk-based asset pricing models that capture the cross-section of expected returns. In this paper, we use a large backward-extended insider trading database from 1975 to 2013 to construct anomaly-specific measures of mispricing that are designed to be unrelated to risk. We find that the predictive ability of both insider trading and anomalies survives when the direction of insider trading agrees with the anomaly but the predictive ability of the anomalies completely disappears when insider trading disagrees with the anomaly. In all cases, insider trading continues to predict future abnormal returns. We conclude that mispricing is an important component of the predictive ability of all thirteen anomalies we consider.
About the Author: Wesley Gray, PhD
—
Important Disclosures
For informational and educational purposes only and should not be construed as specific investment, accounting, legal, or tax advice. Certain information is deemed to be reliable, but its accuracy and completeness cannot be guaranteed. Third party information may become outdated or otherwise superseded without notice. Neither the Securities and Exchange Commission (SEC) nor any other federal or state agency has approved, determined the accuracy, or confirmed the adequacy of this article.
The views and opinions expressed herein are those of the author and do not necessarily reflect the views of Alpha Architect, its affiliates or its employees. Our full disclosures are available here. Definitions of common statistics used in our analysis are available here (towards the bottom).
Join thousands of other readers and subscribe to our blog.

