INTRODUCTION
Funds flows are frequently analyzed by investors to gauge the demand for investment strategies, but it represents a challenging exercise. Key issues are data availability as few market participants disclose their holdings as well as reporting frequency as limited data is published in real-time.
The resulting headlines in media, therefore, are often confusing, although they naturally also reflect that fund flows can change quickly as investor sentiment shifts. For example, glancing at a few headlines regarding the Low Volatility factor from the last few months would likely leave investors questioning whether this strategy was popular or not.
- Investors quickly tired of Low Volatility ETFs (Investopedia, 25th June 2019)
- Money is pouring into Low-Volatility Funds (WSJ, 4th August 2019)
- Min / Low Volatility in demand on macro concerns (ETF Stream, 25th August 2019)
- November rally weighs on Low-Volatility funds (WSJ, 11th November 2019)
The interest in fund flow data is either based on evaluating the potential for returns or risks of an asset class or strategy. The more demand from investors, the higher the returns should be as new money will drive prices higher. However, if a strategy becomes too popular and there are few buyers left, then it might be considered crowded and become prone to drawdowns when the popularity fades.
A simpler and more established method of evaluating the risk-return profile of a strategy is valuation, where high-quality and real-time data is available. Although valuation is common when analyzing stocks, it is less frequently applied when evaluating the relative attractiveness of factors.
In this short research note, we will evaluate the relationship between the fundamental valuation of the Low Volatility factor and its subsequent returns.
METHODOLOGY
We focus our research on the Low Volatility factor in the US, European, and Japanese stock markets. The factor performance is calculated by constructing a long-short beta-neutral portfolio of the top and bottom 30% of stocks ranked by their 12-month volatility. Only stocks with a minimum market capitalization of $1 billion are included. Portfolios are rebalanced monthly and each transaction incurs costs of 10 basis points.
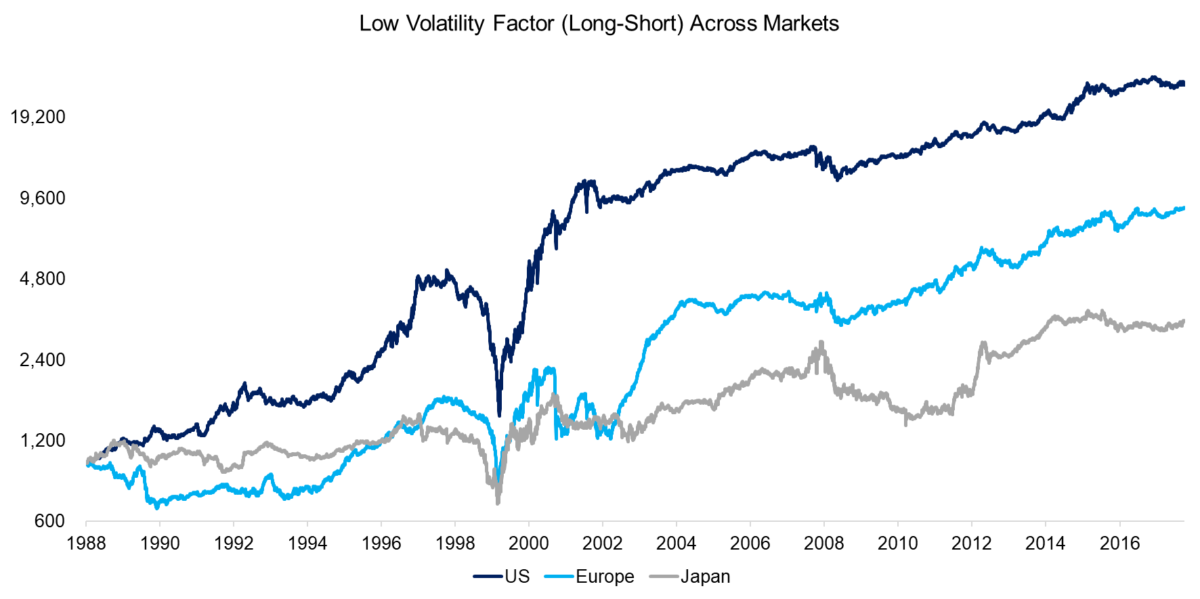
LOW VOLATILITY FACTOR ACROSS MARKETS
The Low Volatility factor became popular with investors after 2009 as low-risk stocks experienced a lower maximum drawdown than the stock market during the global financial crisis. The factor has also generated the best performance over the last 30 years compared to other common equity factors like Value or Momentum.
Contrasting the performance of the long-short factor across markets highlights similar trends that imply common drivers of performance. The returns were strongest in the US and the weakest in Japan, which has been the case for other factors as well. We observe that the strategy experienced a significant drawdown during the tech bubble in 1999 to 2000 when investors exhibited a strong preference for volatile technology stocks like Cisco Systems over unexciting, low-risk stocks such as Berkshire Hathaway.
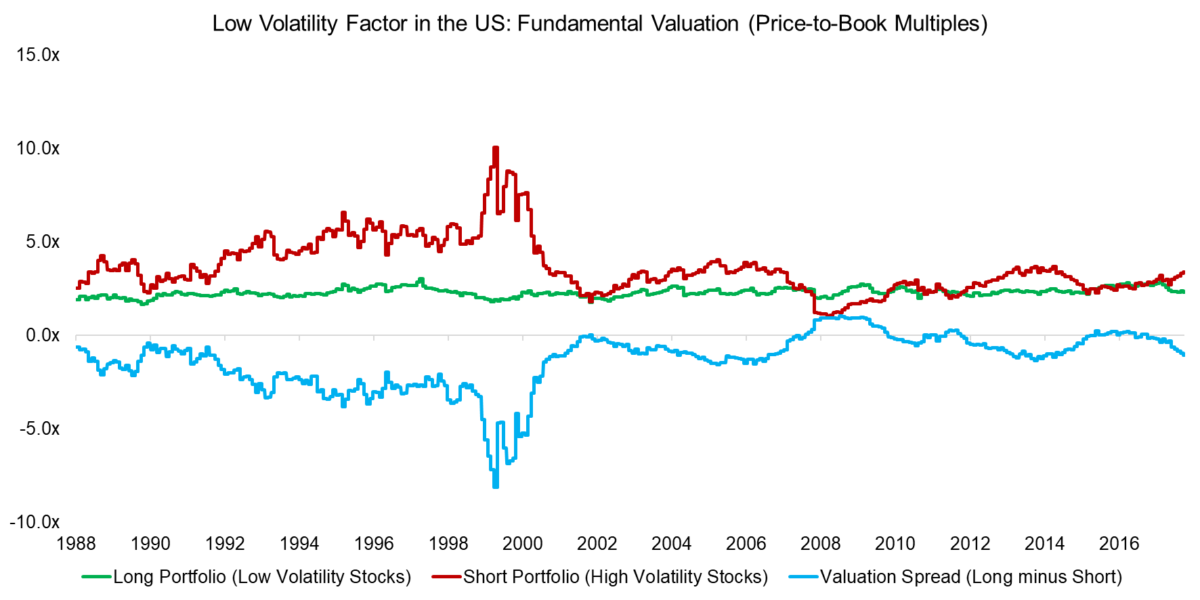
FUNDAMENTAL FACTOR VALUATION
Investors use fundamental valuation metrics for evaluating single securities as well as entire markets. We can use the same methodology for measuring how cheap or expensive a factor is trading relative to its own history. Specifically, we calculate the median price-to-book multiples of the long and short portfolio of the factor, where the difference represents the valuation spread. The higher the spread, the more expensive the factor from a fundamental perspective.
Applying this methodology to the Low Volatility factor in the US highlights the extreme trading conditions during the tech bubble when volatile stocks traded at abnormally high multiples compared to low-risk stocks. We also observe that in the period from 1988 to 2002 the valuation spread was consistently negative while it occasionally became positive thereafter.
The long portfolio tends to be dominated by stocks from the real estate, utilities, and telecom sectors, which feature structurally high leverage and have benefited from decreasing interest rates post the global financial crisis. However, the median price-to-book multiple of the long portfolio has remained relatively flat over time and the change in valuation spread is explained by volatile stocks becoming less expensive.
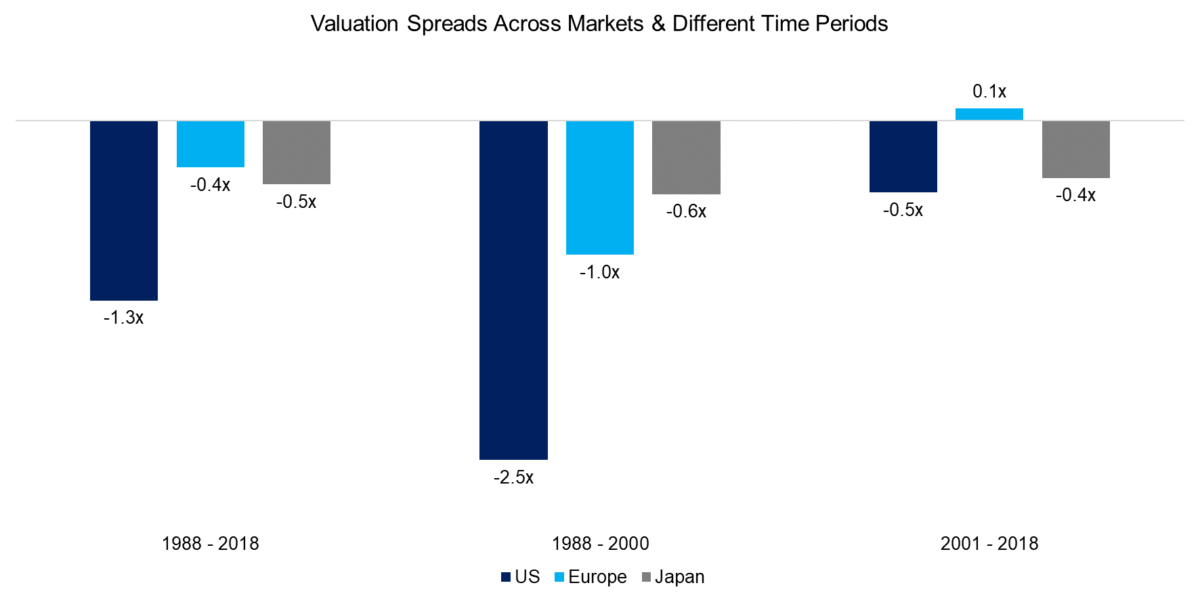
It is worth highlighting that the valuation spreads, similar to the factor performance, exhibited the same trends across regions in the period from 1988 to 2018. However, the absolute levels were substantially different with the average valuation spread being more negative in the US than in Europe and Japan. This implies more dispersion of valuations between low-volatility and high-volatile stocks in the US than in other markets, which perhaps is explained by a larger universe of stocks.
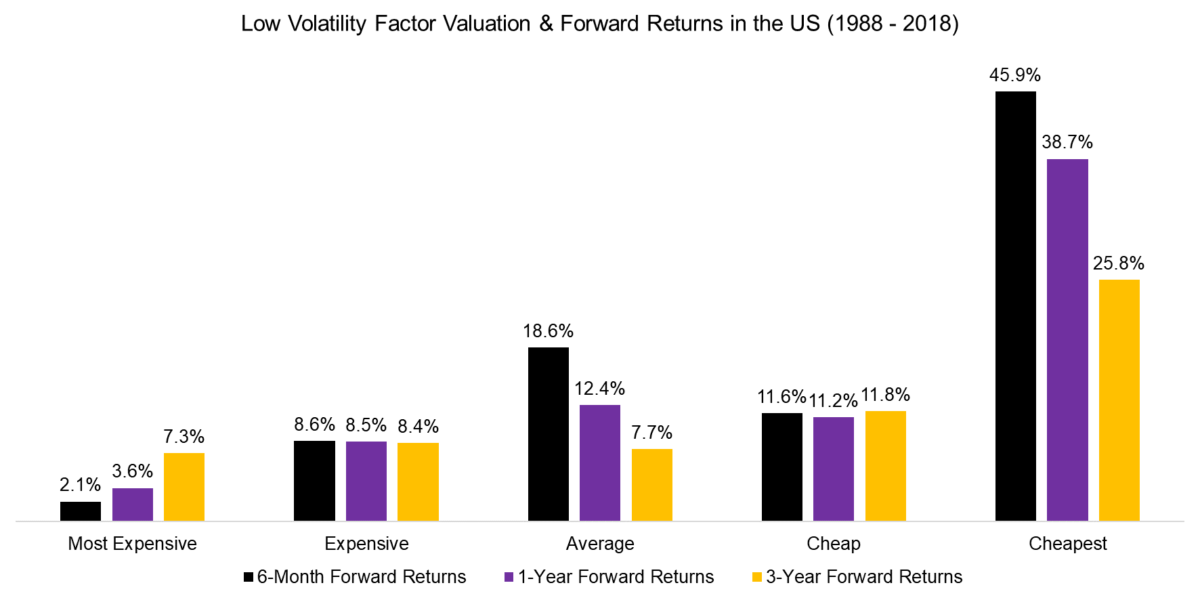
FACTOR VALUATION & FORWARD RETURNS
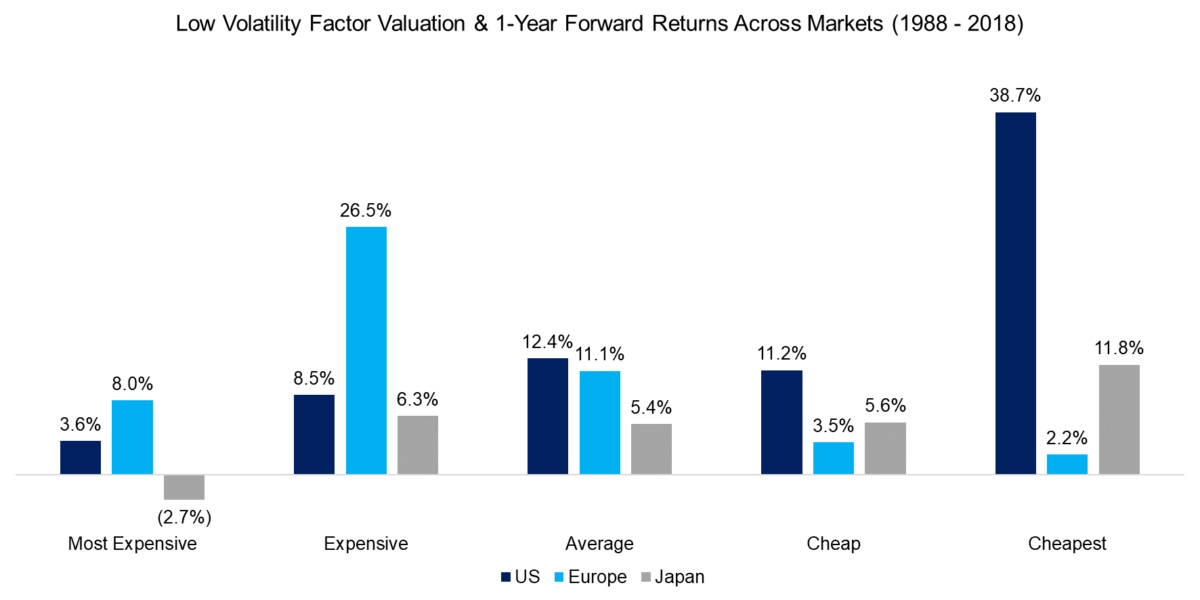
We separate the valuation spread of the Low Volatility factor in the US from 1988 to 2018 into quintiles, which results in five categories that are labeled from most expensive to cheapest. We then measured the forward CAGRs for the next 6 months, next one year, and next three years on a daily basis and average the returns for each of the quintiles.
The analysis highlights that the subsequent returns were higher in the US when the factor was trading cheaply, although it is not a strictly linear relationship. Investors can challenge the analysis as it represents in-sample data and it should be verified out-of-sample or across other regions.
However, based on this result, investors might be intrigued to time an allocation to the Low Volatility factor based on where it is currently trading.
We extend the analysis to Europe and Japan, which creates a more differentiated perspective on allocating to the Low Volatility factor based on its fundamental valuation.
In Japan, there was little difference in 1-year forward returns, except when the factor was trading at its most expensive or cheapest valuations. However, in Europe, the subsequent return was lowest when the factor was trading most cheaply, which is not intuitive. This is explained by the periods from 1988 to 1990 and 1998 to 2002, where the valuation spread was at its most negative levels, but the performance was also poor.
FURTHER THOUGHTS
Historically valuations have been used in comparing stocks relatively to each other, and more recently comparing overall market valuation against its historical averages(1). The concept of timing a factor based on valuations has not been utilized to the degree that it has been for individual securities or market-wide analysis. Therefore we thought it would be an interesting exercise to dig a little deeper into the idea. Although it is interesting to investigate the practice of timing an allocation to a factor based on its fundamental valuation, it is a difficult and risky method to follow. I would argue that factor timing may be best utilized in reducing risk, though more work would have to be done to definitively come to that conclusion.
RELATED RESEARCH
Low Volatility: From Obscurity to Stardom

About the Author: Nicolas Rabener
—
Important Disclosures
For informational and educational purposes only and should not be construed as specific investment, accounting, legal, or tax advice. Certain information is deemed to be reliable, but its accuracy and completeness cannot be guaranteed. Third party information may become outdated or otherwise superseded without notice. Neither the Securities and Exchange Commission (SEC) nor any other federal or state agency has approved, determined the accuracy, or confirmed the adequacy of this article.
The views and opinions expressed herein are those of the author and do not necessarily reflect the views of Alpha Architect, its affiliates or its employees. Our full disclosures are available here. Definitions of common statistics used in our analysis are available here (towards the bottom).
Join thousands of other readers and subscribe to our blog.