From 2017 through 2019, the Russell 1000 Growth Index returned 20.5 percent per annum, outperforming the Russell 1000 Value Index, which returned 9.7 percent, by 10.8 percentage points a year; and the Russell 2000 Growth Index returned 12.5 percent per year, outperforming the Russell 2000 Value Index, which returned 4.8 percent, by 7.7 percentage points per year. The annual average value premium was -10.2 percent, producing a total return of -27.7 percent. And some would argue the ride on the value pain train has been even longer. (1)
We observe similar evidence of growth outperforming value in international markets. The MSCI EAFE Growth Index returned 13.3 percent per year, outperforming the 9.8 percent return of the MSCI Small Value Index by 3.5 percentage points per year; and the MSCI Emerging Markets Index outperformed the MSCI Emerging Markets Value Index by 3.4 percentage points per year (12.0 percent to 8.6 percent).
Thanks to the research team at Verdad, we can see just how tough the test of discipline that value (especially small value) investors were put to in the first 10 months of 2019. During this period the value premium was -10.9 percent (it was virtually zero in the last two months). However, the largest 20 percent of stocks that also were in the quintile of most expensive returned 25.3 percent compared to less than 1 percent return for the smallest quintile of stocks by market cap that were also the cheapest. This contrasts with the evidence of the prior 30 years, during which the largest, most expensive stocks returned 9.5 percent, underperforming the 19.4 percent return of the cheapest, small stocks by 9.9 percentage points per year.
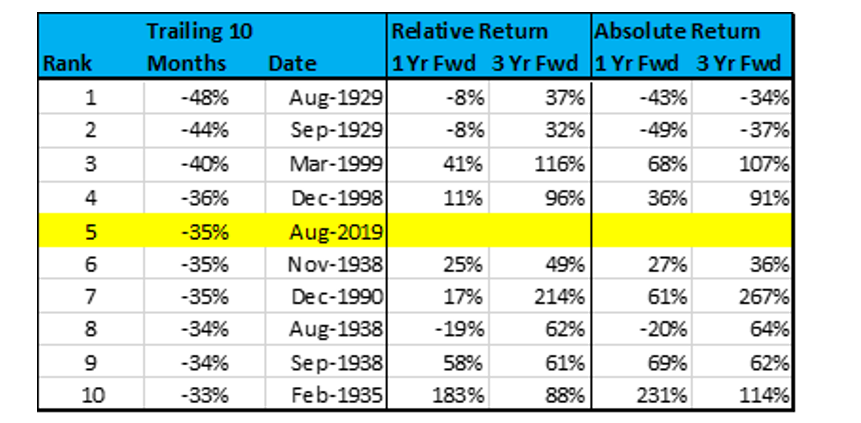
While the cheapest small stocks have generally far outperformed the most expensive large stocks, 2017 through 2019 is not the only period during which small value stocks dramatically underperformed. If that were not the case, there would be no risk investing in them, and their premium would have disappeared long ago. That said, Verdad found that there were only two periods worse than the first 10 months of 2019 for U.S. small-cap value on a relative basis: right before the Great Depression in 1929 and at the height of the tech bubble in 1999.
An important question for investors considering abandoning their faith in the long-term evidence favoring small value stocks is: How have small value stocks performed after periods of very poor performance? Verdad examined the performance of the 10 worst 10-month periods for U.S. small-cap value relative to large-cap growth over the past 100 years. They found that, on average, when small-cap value stocks have lagged by around 30 percent, the one- and three-year forward returns have been very attractive on an absolute and relative basis.
The finding that periods of extremely poor performance are typically followed by periods of strong performance should not be a surprise. The reason is that periods of extremely poor performance are typically accompanied by a widening of the spread in valuations. And valuations are the best predictor we have of future returns. This is exactly what Verdad found. The figure below shows the price-to-cash-flow multiples for the whole U.S. market going back to 1951 (which is as far back as they had data). They used the two most extreme valuation deciles of the market (growth and value). The chart shows the absolute trading multiples of each extreme as well as the ratio of the prices of the two (“spreads”) over time. The source is Ken French’s Data Library.
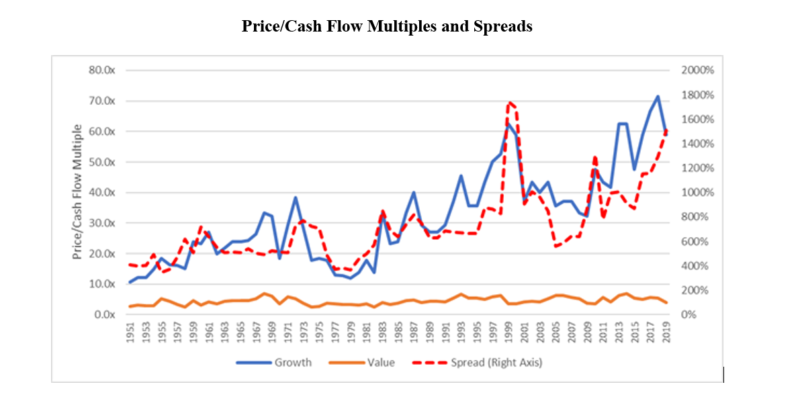
As the chart shows, the massive divergence in the returns of the most extreme deciles of growth and value stocks has led to a massive jump in spreads for deep value that is only rivaled by the tech bubble—a period that was followed by the Fama-French U.S. Small Value Research Index outperforming the Fama-French U.S. Large Growth Research Index by 16 percentage points per year over the next eight years (16.2 percent versus 0.2 percent), producing a total return difference of about 230 percentage points. Keep this in mind if you are considering abandoning your belief that small value stocks are likely to outperform in the long term.
Verdad also looked at every 10-month period during the last 100 years when small value has underperformed large growth by more than it underperformed during the first 10 months of 2019, a total of about 50 times. Though there was no guarantee that small value would outperform over the following one- and three-year periods, they found that you would have generally done quite well to shift to small value. You would have outperformed large growth 63 percent of the time over one year and 88 percent of the time over the next three years, earning an average premium of 70 percent over three years relative to large growth! That said, I’ve stated before that factor timing is not without it’s challenges.
Summary
One of the most important concepts to grasp is that investing is about dealing with both risk and uncertainty. University of Chicago professor Frank Knight wrote the classic book “Risk, Uncertainty, and Profit.” An article from the Library of Economics and Liberty described Knight’s definitions of risk and uncertainty as follows: “Risk is present when future events occur with measurable probability. Uncertainty is present when the likelihood of future events is indefinite or incalculable.”
Since investing is closer to uncertainty than it is to risk, the best we can do is estimate the odds of success and try to put them in our favor. The evidence clearly demonstrates that the most likely way to put the odds in your favor is to follow Warren Buffett’s sage advice, which is that if you cannot avoid market timing, at least buy when others are abandoning their plans and engaging in panicked selling. In other words, buy after periods of poor performance when valuations are cheapest and expected returns are highest. While not a guarantee of success, the historical evidence suggests it’s a far better strategy than selling after periods of poor performance.
It also helps to remember that it’s having to bear the pain of investing in unpopular, little-known companies during periods such as 2017 through 2019 that creates the premium that investors who were able to stay the course have earned. And finally, there are no successful investment strategies that do not require you to bear the pain of underperformance for long periods—much longer than most investors believe is likely.

References[+]
| ↑1 | Editor’s Note: we are on record suggesting, tongue in cheek, that value investing is the worst idea ever. |
|---|
About the Author: Larry Swedroe
—
Important Disclosures
For informational and educational purposes only and should not be construed as specific investment, accounting, legal, or tax advice. Certain information is deemed to be reliable, but its accuracy and completeness cannot be guaranteed. Third party information may become outdated or otherwise superseded without notice. Neither the Securities and Exchange Commission (SEC) nor any other federal or state agency has approved, determined the accuracy, or confirmed the adequacy of this article.
The views and opinions expressed herein are those of the author and do not necessarily reflect the views of Alpha Architect, its affiliates or its employees. Our full disclosures are available here. Definitions of common statistics used in our analysis are available here (towards the bottom).
Join thousands of other readers and subscribe to our blog.