The value spread is the difference between the value signal in the long versus the short portfolio. This isn’t the first time we have hit on this topic. Wes and I have done several posts on the subject:
- Timing Value and Momentum with Valuation-Spreads
- The Returns to Value Strategies When Valuation Spreads Are Wide (Deep Value)
- The Forecasting Power of Value, Profitability, and Investment Spreads
- Factor Timing Investigation: Interest Rates, Value Spreads, and Factor Premiums
In light of the historically poor performance of the value premium for the period beginning in the fourth quarter of 2016 and ending in the first quarter of 2020, mainly caused by a widening of the spread between valuations of growth and value stocks, an interesting question is: Does that spread contain information as to future returns?
Fahiz Baba Yara, Martijn Boons, and Andrea Tamoni contribute to the factor literature with their study “Value Return Predictability Across Asset Classes and Commonalities in Risk Premia,” published in the March 2021 issue of the Review of Finance. They used the book-to-market ratio as their measure of value for individual stocks, industries, and global stock indexes. They also considered a second set of industry-adjusted book-to-market ratios for 17 industries. For other asset classes, they used long-term past returns. Consistent with prior research, they excluded financials. Their focus was on the set of relatively large and liquid stocks that cumulatively account for 90 percent of the total market capitalization. Their data set covered the period January 1972 to December 2017. Following is a summary of their findings:
- For industries, commodities, currencies, global government bonds, and stock indexes, most value strategies obtained a positive Sharpe ratio, but there was considerable variation in magnitude. Annualized Sharpe ratios ranged between 0.20 and 0.30 for the value strategies in commodities, currencies, and stock indexes. The Sharpe ratio of the value strategy using government bonds was -0.03.
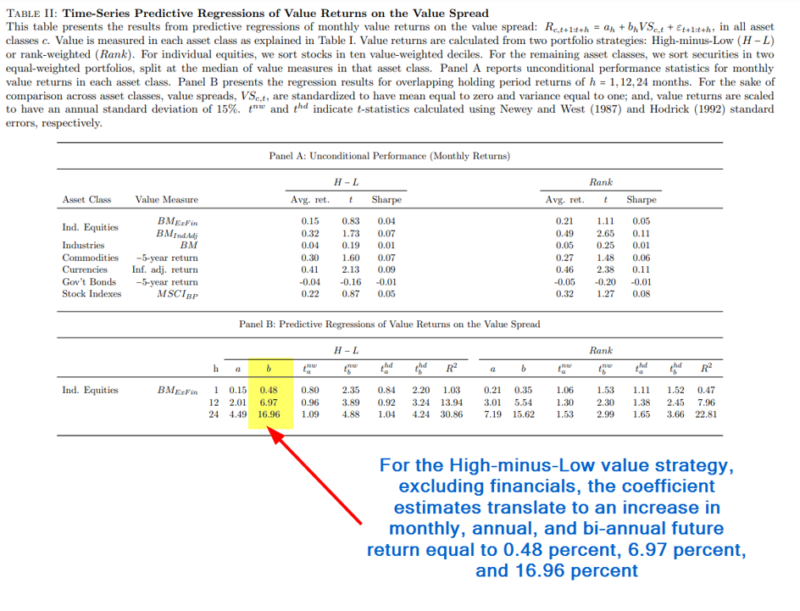
- Returns to value strategies in individual equities, industries, commodities, currencies, global government bonds, and global stock indexes are predictable in the time series by their respective value spreads—an increase in the value spread predicts an increase in expected value return. The coefficient on the value spread was positive for all asset classes and for all horizons. The evidence was strong at the annual horizon, where the coefficient estimate was significant and positive at the 10 percent level in all asset classes. Similarly, strong evidence was found at the two-year horizon, with global equity indexes significant at the 10 percent level and all other asset classes significant at the 5 percent level. Both the coefficient estimates and R-squared values were, in most cases, increasing with the horizon.
- The economic magnitudes of the coefficients on the value spread were large. For the high-minus-low value strategy, excluding financials, the coefficient estimates translated to an increase in monthly, annual, and biannual future return equal to 0.48 percent, 6.97 percent, and 16.96 percent (with t-stats of 2.20, 3.24, and 4.24), respectively, for a standard deviation increase in the value spread.
- Across asset classes, expected value returns vary by at least as much as their unconditional level.
- Value spreads widen when risk aversion is high—they widen when discount rates (and thus expected value returns) are high.
- Expected value returns are globally high in bad times and remain high for a number of years. Moreover, two proxies for the risk of financial intermediaries—market leverage and funding liquidity—together with a measure of risk aversion explain the bulk of time variation in the common component. These proxies have become progressively more important over time.
- A single common component of the value spreads captures about two-thirds of value return predictability, and the remainder is asset-class specific.
- Common variation in value premia is consistent with rationally time-varying expected returns because (1) common value is closely associated with standard proxies for risk premia, such as the dividend yield, intermediary leverage, and illiquidity, and (2) value premia are globally high in bad times.
Their findings led Yara, Boons, and Tamoni to conclude:
“The value premium in equities strongly increases (decreases) as the cross-section of valuation ratios expands (compresses).”
They added:
“The value spread predicts value returns similarly in the other asset classes.” And finally: “These results suggest that information in the value spread can be used by investors to time value [rotate positions] in the stock market. Moreover, this timing strategy is an attractive complement to an unconditional value strategy.”
The bottom line is they demonstrated that value investing has been most attractive with value spreads that are large relative to other asset classes.
As mentioned earlier, the poor performance of value stocks in the period ending March 2020 was caused mainly by a widening of the valuation spreads. Consider that in December 1994 (shortly after the publication by Gene Fama and Ken French of their seminal paper “The Cross-section of Expected Stock Returns”), the relative price-to-book ratio of value stocks versus growth stocks was 2.1. Using Vanguard’s Value ETF (VTV) and their Growth ETF (VUG), at the end of April 2021 that ratio had widened to 3.2 (52 percent wider), predicting a much larger value premium than Fama-French had found. We see the same pattern when looking at small value and growth stocks. At the end of 1994, the spread was 1.5. Using Vanguard’s Small-Cap Value ETF (VBR) and their Small-Cap Growth ETF (VBK), the spread had widened to 2.3 (53 percent wider). Once again, the widening of the spread predicts a larger value premium than Fama-French had found. In other words, in terms of expected returns, the data suggests that the outperformance of value since April 2021 is likely to continue, as Yara, Boons, and Tamoni found that the spread has a strong predictive value two years out.
Important Disclosure
The information presented is for educational purposes only and should not be construed as specific investment, accounting, legal, or tax advice. Certain information may be based upon third-party information which may become outdated or otherwise superseded without notice. Third-party data is deemed to be reliable, but its accuracy and completeness cannot be guaranteed. Mentions of specific securities are for illustrative purposes only and should not be construed as a recommendation. The opinions expressed by featured authors are their own and may not accurately reflect those of the Buckingham Strategic Wealth® or Buckingham Strategic Partners®, collectively Buckingham Wealth Partners. LSR–21-90

About the Author: Larry Swedroe
—
Important Disclosures
For informational and educational purposes only and should not be construed as specific investment, accounting, legal, or tax advice. Certain information is deemed to be reliable, but its accuracy and completeness cannot be guaranteed. Third party information may become outdated or otherwise superseded without notice. Neither the Securities and Exchange Commission (SEC) nor any other federal or state agency has approved, determined the accuracy, or confirmed the adequacy of this article.
The views and opinions expressed herein are those of the author and do not necessarily reflect the views of Alpha Architect, its affiliates or its employees. Our full disclosures are available here. Definitions of common statistics used in our analysis are available here (towards the bottom).
Join thousands of other readers and subscribe to our blog.