Momentum, the tendency of past winner stocks to outperform past loser stocks over the next several months, is one of the most well-documented and well-researched asset pricing anomalies. In the asset pricing literature, momentum is generally defined over the short-, medium- and long-term in the following manner:
- Short-term reversals are defined as the prior month’s (t − 1) return.
- Medium-term momentum is defined as the returns from month (t – 2) to (t – 12).
- Long-term reversals are defined as the returns from month (t – 13) to (t – 60).
The most recent month is excluded from the medium term because it tends to show a reversal. In our book “Your Complete Guide to Factor-Based Investing,” Andrew Berkin and I present the evidence of a momentum premium that has been persistent across long periods of time, pervasive around the globe and across asset classes, robust to various definitions, and survives transactions costs. As Bryan Kelly, Tobias Moskowitz, and Seth Pruitt, authors of the study “Understanding Momentum and Reversals,” published in the June 2021 issue of the Journal of Financial Economics, noted:
“Despite its widespread influence on the finance profession, momentum remains a mysterious phenomenon. A variety of positive theories, both behavioral and rational, have been proposed to explain momentum, but none are widely accepted.”
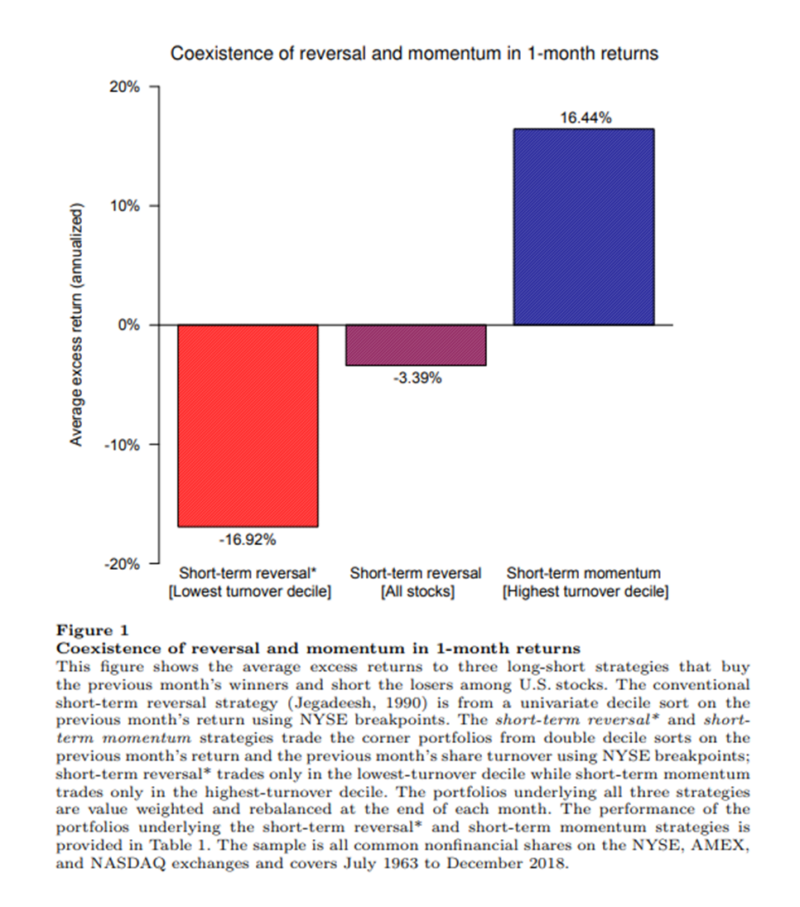
Mamdouh Medhat and Maik Schmeling contribute to the momentum literature with their study “Short-term Momentum,” published in the March 2022 issue of The Review of Financial Studies. (an older version can be found here) Their main data sample covered all common nonfinancial shares on the NYSE, AMEX, and Nasdaq exchanges over the period of July 1963-December 2018. Portfolios were value-weighted and rebalanced at the end of each month. Abnormal returns were relative to Fama and French’s five-factor model plus the momentum factor.
Following is a summary of their findings:
- Reversal and momentum coexist with striking magnitudes at the one-month horizon—double sorting on the previous month’s return and share turnover revealed significant short-term reversal among thinly traded, low-turnover stocks, whereas high-turnover stocks exhibited short-term momentum.
The results are hypothetical results and are NOT an indicator of future results and do NOT represent returns that any investor actually attained. Indexes are unmanaged, do not reflect management or trading fees, and one cannot invest directly in an index.
- Collectively, all stocks exhibited negative short-term (one-month) momentum, returning -3.4 percent. However, the strategy that buys the previous month’s winners and shorts the losers within the lowest turnover decile yielded -1.41 percent per month (t-stat = 7.13), evidence of a strong reversal in one-month returns for low-turnover stocks. Conversely, the winner-minus-loser strategy within the highest turnover decile yielded 1.37 percent per month (t-stat = 4.74), evidence of strong continuation in one-month returns for high-turnover stocks. Thus, the well-documented one-month reversal anomaly is explained by the negative performance of low turnover stocks.
- Double sorts also revealed a significant one-month reversal in the bottom seven turnover deciles, with the magnitude of the reversal effect generally weakening with turnover before switching signs and becoming significantly positive in the highest turnover decile.
- The short-term momentum strategy (STMOM) is as profitable and as persistent as conventional price momentum—it survives transaction costs and is strongest among the largest, most liquid, and most extensively covered stocks.
- The short-term reversal strategy (STREV) yielded 0.84 percent per month among large caps (t-stat = 5.45) but a considerably larger 1.41 percent per month among small caps (t-stat = 9.03). STMOM, on the other hand, yielded a significant 0.62 percent per month among large caps (t-stat = 3.01) but an insignificant 20 basis points per month among small caps.
- STREV yielded an extremely large 2.04 percent per month among microcaps (t-stat = 10.28) but a comparably much smaller 0.74 per month among megacaps (t-stat = 4.27)—the lion’s share of STREV returns came from microcaps. Despite the large gross return, STREV’s average monthly transaction cost of 1.94 percent subsumed its average gross return.
The results are hypothetical results and are NOT an indicator of future results and do NOT represent returns that any investor actually attained. Indexes are unmanaged, do not reflect management or trading fees, and one cannot invest directly in an index.
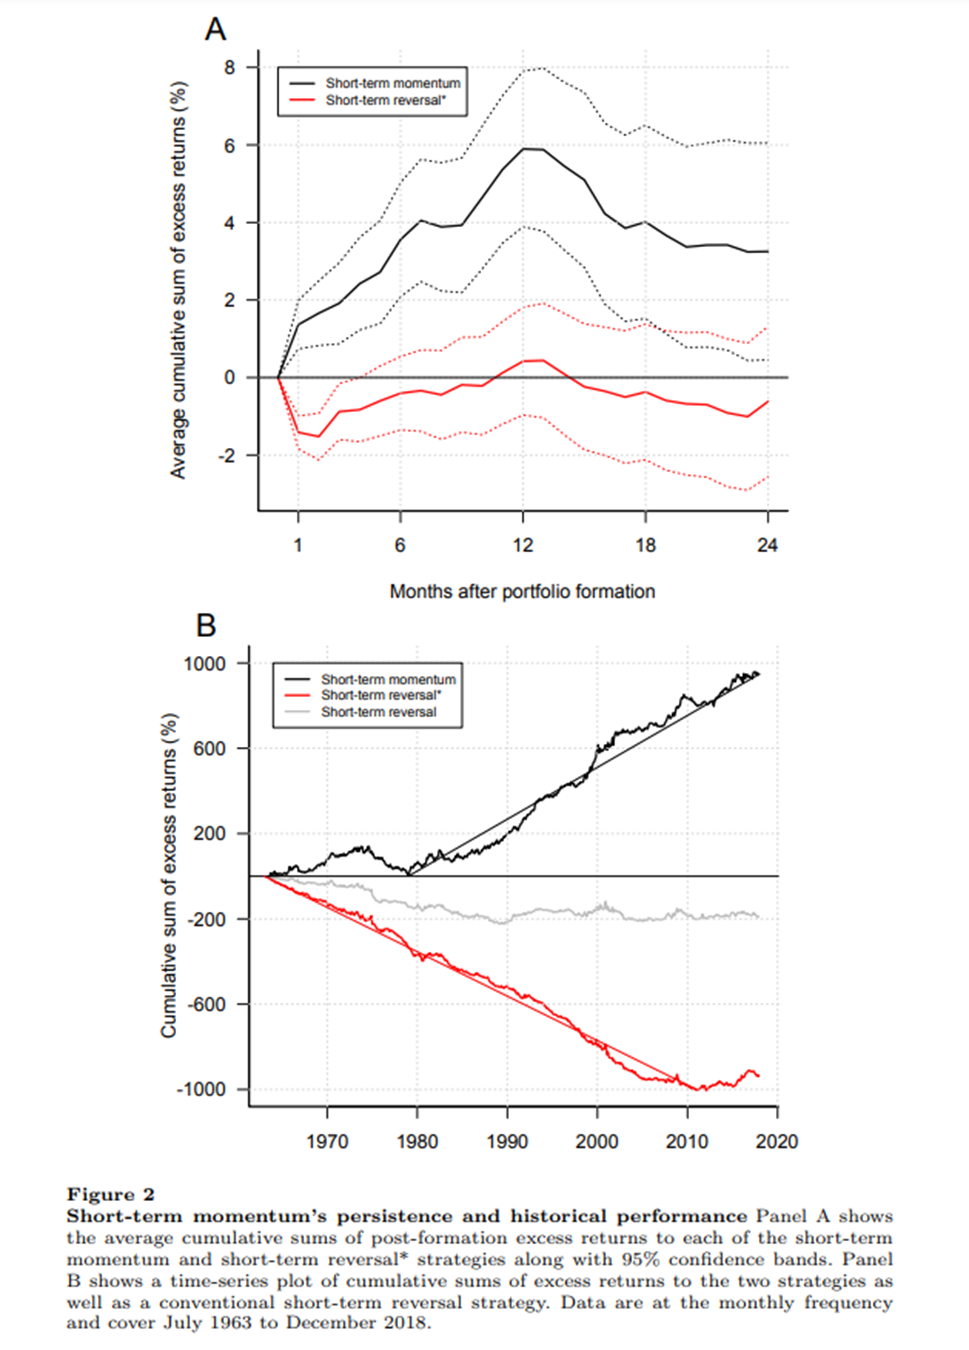
- Short-term reversal (STREV) returns were remarkably consistent until 2011 but slightly tapered off more recently. The authors theorized that generally increasing market liquidity is responsible for this trend. On the other hand, while STMOM earned low returns during 1975-79, it otherwise delivered consistently positive returns with no other subsample significantly affecting its performance.
- Short-term momentum persists for 12 months and is strongest among the largest and most liquid stocks. On the other hand, short-term reversal was indistinguishable from zero after two months.
- Short-term momentum does not appear to be driven by momentum in industry returns.
- Short-term momentum exhibits far less crash risk than does conventional price momentum.
- Short-term momentum is not a result of any correlation between share turnover and size, liquidity or volatility.
- The STREV strategy had only modest loadings on the Fama-French six factors.
- The interaction of one-month returns and turnover predicts the following year’s growth in gross profits and earnings, with a positive and significant slope coefficient.
- Their findings extended to 22 developed markets outside the United States.
- Their main results extended back to 1926 in the U.S.
- Their findings were robust to using longer formation periods of up to six months, but the one-month formation period produced the strongest results.
Their findings led Medhat and Schmeling to conclude:
“Our results are difficult to reconcile with models imposing strict rationality but are suggestive of an explanation based on some traders underappreciating the information conveyed by prices.”
Investor Takeaways
Medhat and Schmeling’s findings add to a large body of evidence demonstrating that momentum (short-, medium-, and long-term) provides incremental explanatory power to the cross-section of equity returns. Their main contribution was that they documented that short-term reversal was fully explained by stocks in the lowest deciles of turnover. The fact that the largest, most liquid stocks actually exhibited short-term momentum with economically and statistically significant premiums is an important new finding, allowing long-only investors to exploit the short-term momentum of stocks with very low transaction costs. Another takeaway is that the finding that STREV’s high transaction costs subsumed the high gross return does not mean the information is without value. For example, a fund considering buying a microcap stock could delay buying based on the signal provided by STREV.
Important Disclosures
For informational and educational purposes only and should not be construed as specific investment, accounting, legal, or tax advice. Certain information is based upon third party data which may become outdated or otherwise superseded without notice. Third party information is deemed to be reliable, however its accuracy and completeness cannot be guaranteed. Information from sources deemed reliable, but its accuracy cannot be guaranteed. By clicking on any of the links above, you acknowledge that they are solely for your convenience, and do not necessarily imply any affiliations, sponsorships, endorsements or representations whatsoever by us regarding third-party websites. We are not responsible for the content, availability or privacy policies of these sites, and shall not be responsible or liable for any information, opinions, advice, products or services available on or through them. The opinions expressed by featured authors are their own and may not accurately reflect those of the Buckingham Strategic Wealth® or Buckingham Strategic Partners®, collectively Buckingham Wealth Partners. Neither the Securities and Exchange Commission (SEC) nor any other federal or state agency have approved, determined the accuracy, or confirmed the accuracy of this article. LSR-22-256
About the Author: Larry Swedroe
—
Important Disclosures
For informational and educational purposes only and should not be construed as specific investment, accounting, legal, or tax advice. Certain information is deemed to be reliable, but its accuracy and completeness cannot be guaranteed. Third party information may become outdated or otherwise superseded without notice. Neither the Securities and Exchange Commission (SEC) nor any other federal or state agency has approved, determined the accuracy, or confirmed the adequacy of this article.
The views and opinions expressed herein are those of the author and do not necessarily reflect the views of Alpha Architect, its affiliates or its employees. Our full disclosures are available here. Definitions of common statistics used in our analysis are available here (towards the bottom).
Join thousands of other readers and subscribe to our blog.