Despite the fact that a company’s internally generated intangible investments create future value, (Summary) under current U.S. generally accepted accounting principles, internally developed intangibles are not included in reported assets. While research and development (R&D) is an important intangible asset, so too is branding. Omission of an increasingly important class of assets reduces the usefulness and relevance of financial statement analysis that uses book value.
In his 2007 letter to Berkshire Hathaway shareholders, Warren Buffett stated:
“A truly great business must have an enduring ‘moat’ that protects excellent returns on invested capital. The dynamics of capitalism guarantee that competitors will repeatedly assault any business ‘castle’ that is earning high returns. Therefore, a formidable barrier such as a company’s…possessing a powerful world-wide brand (Coca-Cola, Gillette, American Express) is essential for sustained success.”
The issue for investors is that because they think the “moat” attributes of valued brands and stellar reputations make for great investments, demand for companies with these characteristics pushes up valuations and should lead to lower future returns. The result is that there could be a big difference between great companies and high-returning investments. On the other hand, leading brands may be undervalued because accounting rules treat investments in branding as operating expenses—they are expensed in the year incurred and no associated (brand) asset is created on the balance sheet, leading to lower accounting earnings and book value of equity.
To determine if the market has efficiently priced the value of the intangible asset of brands, Hamid Boustanifar and Young Dae Kang, authors of the June 2022 study “Is Buffett Right? Brand Values and Long-run Stock Returns,” investigated the stock market valuation of the most visible intangible asset, brand capital. Their focus on brand capital was motivated by three main observations:
- Brand capital constitutes a significant portion of firm value, with prior studies estimating the average contribution of brand capital to firm value to be in the range of 10-23 percent, a ratio that is significantly larger (up to 60 percent) for companies that produce and sell consumer brand products.
- Unlike other forms of intangible capital (such as R&D and employee satisfaction), there is a clear link between having a more recognized brand name and higher firm value—top brands charge higher prices; have more loyal customers; enjoy durable advantages over competitors and face lower threats from entrants; have lower financial constraints and higher cash flow stability; can more easily attract and retain their employees; and elicit greater customer interest in trying, adopting and personally promoting a new branded product.
- Unlike other forms of intangible capital that may not be readily and directly observable by market participants, brand names are highly visible. As a result, while one might expect other intangibles to be underpriced (in case of mispricing), brand value is likely to be overpriced due to the popularity of top brands.
To measure brand value, they used Interbrand’s annual ranking of the World’s Most Valuable Brands. The three key indicators that determine the brand value are: the financial performance of the branded products or services, the role of the brand in the purchase decision process, and the strength of the brand. The authors explained: “Interbrand pioneered brand valuation methodology in the 1980s and its valuation methodology is widely accepted by auditors and tax authorities around the world and reliable for use in financial reporting statements. Interbrand’s measurement of brand value is based on predicting future incremental earnings derived from the brand and calculating their net present value. This is precisely how marketing scholars define brand equity and how intrinsic market value of a brand name is estimated.” They added: “To be included in the Interbrand assessment, a company must meet a number of criteria. Specifically, the brand needs to be global (i.e., at least 30% of its revenue must come from outside the brand’s home region and the company must have a presence in Asia, Europe, and North America), have publicly available data on the brand’s financial performance, be visible (the brand must have a public profile and sufficient awareness across major economies of the world), and have the expectation of positive long-term economic profits (the return must be above the brand’s cost of capital).” Starting in 2000, Interbrand began publishing an annual list of best brands (BBs).
The initial list included 75 global brands in 2000 and increased to 100 brands in 2001. Their BB portfolio was formed (or rebalanced) on the first day of the month following the announcement date (until 2007, the lists were published in July or August; subsequently, publication was moved to late September or October). The authors explained:
“The few weeks of delay between the list announcement and our portfolio formation/rebalancing allows sufficient time for the market to react to the news. Therefore, our analysis effectively allows the market to price in the effect of the brand value announcement and then investigates whether the stock market fully incorporates the impact of brand capital on future returns.”
Note that the BB list is based on brands, not companies—multiple brands from the same company may appear separately as top brands in the same year. Thus, their analysis was at the stock level, with brands mapped to stocks. (This raises an issue about the research: For example, if company X has top brand A that doesn’t necessarily reflect on the whole company, what percent of sales is the brand?)
The average number of companies included in the BB portfolio annually was 47. Because the value-weighted BB portfolio was dominated by a few extremely large companies, they chose to also show results on an equal-weighted basis, allowing for more diversification. Returns were benchmarked against commonly used asset pricing models: Fama-French (FF) three-factor (beta [MKT], size [SMB] and value [HML]); Carhart four-factor (adding momentum [MOM]); FF six-factor (adding profitability [RMW] and investment [CMA]); q-4 factor (market [R_MKT], size [R_ME], investment [R_IA] and profitability [R_ROE]); q-5 factor (adding expected investment growth [R_EG]); and AQR six-factor (market [MKT], size [SMB], value [HML], momentum [UMD], betting against beta [BAB] and quality minus junk [QMJ]).Their sample included U.S. stocks over the period September 2000-December 2020. Following is a summary of their findings:
- The sum of all brand values in the list increased from about $900 billion in 2000 to more than $2.3 trillion in 2020, with brand values of the top 10 brands totaling $1.2 trillion in 2020, constituting 50 percent of the values of all 100 brands.
- Industries with the most BBs included computer software, computers, business services, consumer goods, and restaurants and hotels, while those with the lowest numbers were recreation, aircraft, petroleum and natural gas, insurance, and personal services.
- BBs are large companies with a mean (median) market cap of $288 billion ($143 billion) in 2020—about 90 percent of BBs have market capitalizations that are larger than the 80th percentile NYSE size breakpoint. They rarely observed a BB with a size below the 50th NYSE breakpoint. (This finding should not be surprising because of the author’s criteria that the company needs to be global. A company could have a great brand locally, but it wouldn’t make the list because of global criteria—making it highly unlikely a smaller cap company would make the list.)
- BBs spent, on average, 11.92 percent (7.74 percent) of their gross profit on advertising in year 2000 (2020). The average ratio masks a significant variation across BBs—some BBs spend relatively little on advertising (e.g., Accenture, Cisco, Deere & Company), while others devote more than 15 percent of their gross profit to advertising (e.g., The Walt Disney Company, Colgate-Palmolive, Nike).
- Examining earnings surprises, analysts tended to underestimate earnings of BBs in their forecasts. The authors explained: “This is consistent with the idea that it is difficult to fully incorporate future upside potentials of brand names as they can easily market a new product or enter a completely new business by leveraging their recognized brand.”
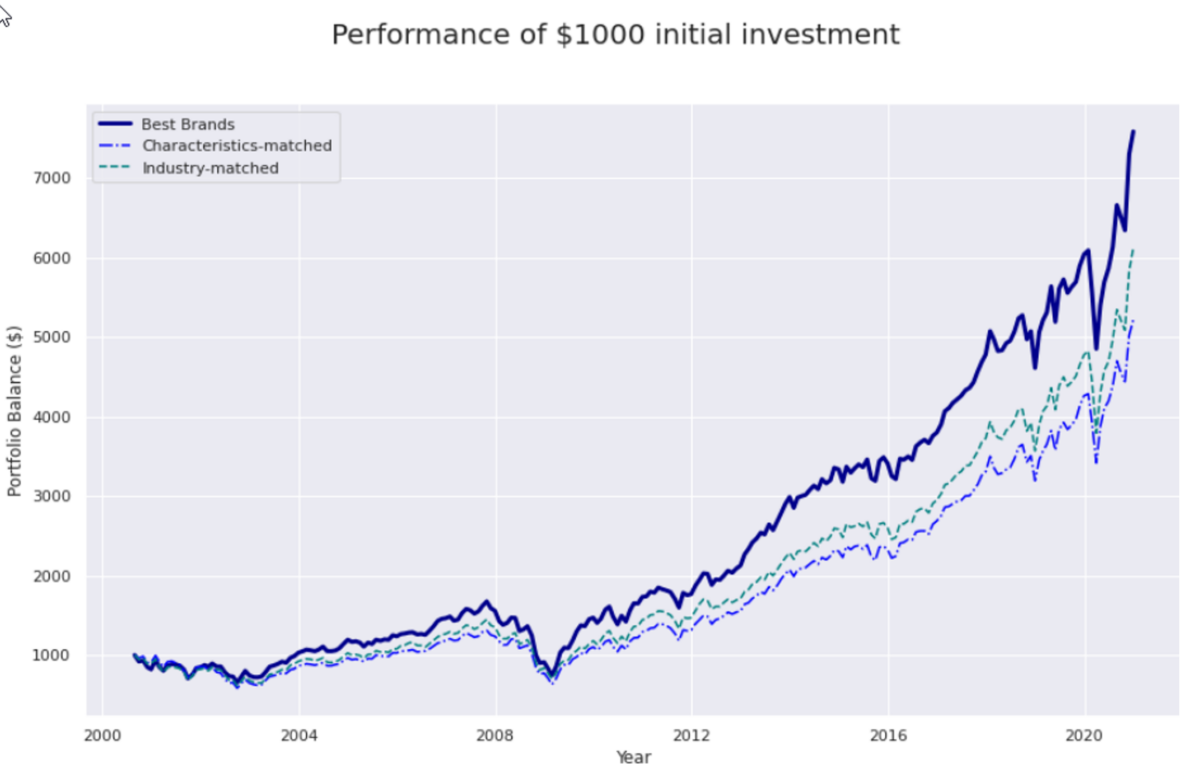
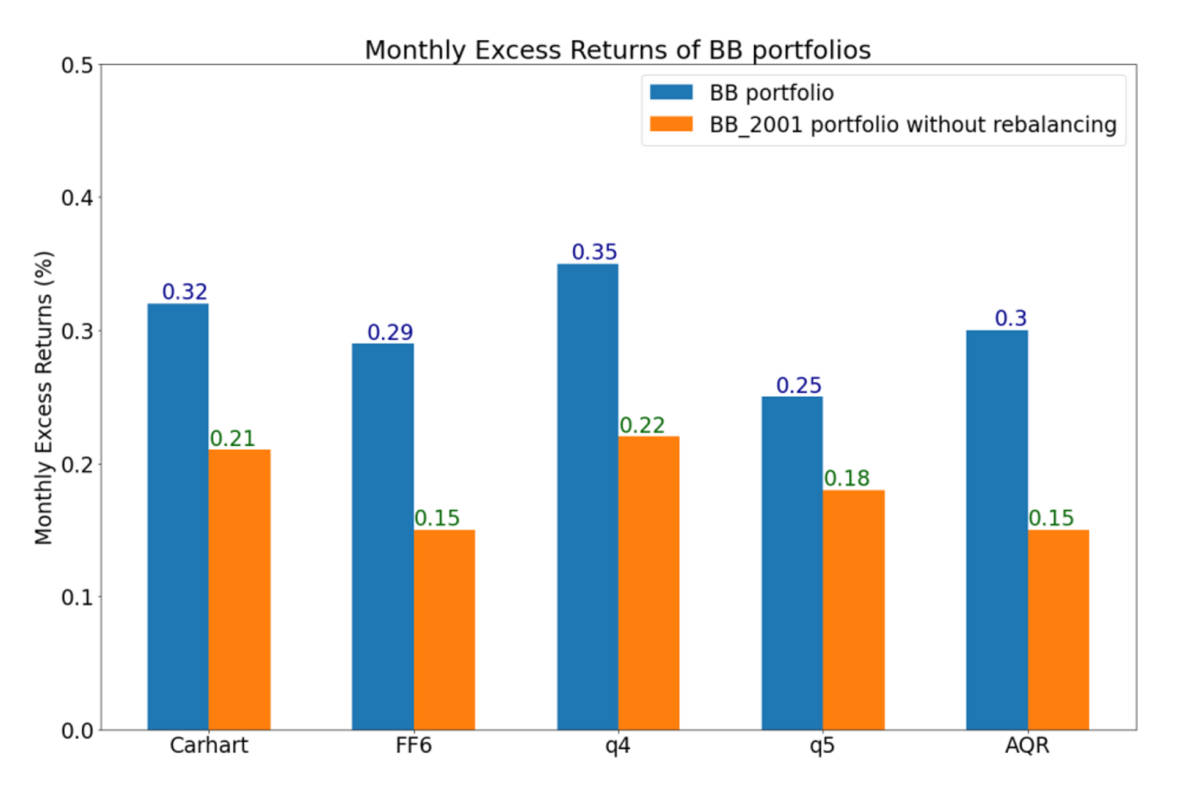
- There was a positive and significant excess return associated with the BB portfolio that was robust across all the factor models, with an equal-weighted portfolio of Interbrand’s yearly list of BBs in the U.S. earning a monthly excess return of 25 to 35 basis points (bps) from 2000 to 2020 excluding the short-term market reaction to the BB list announcement.
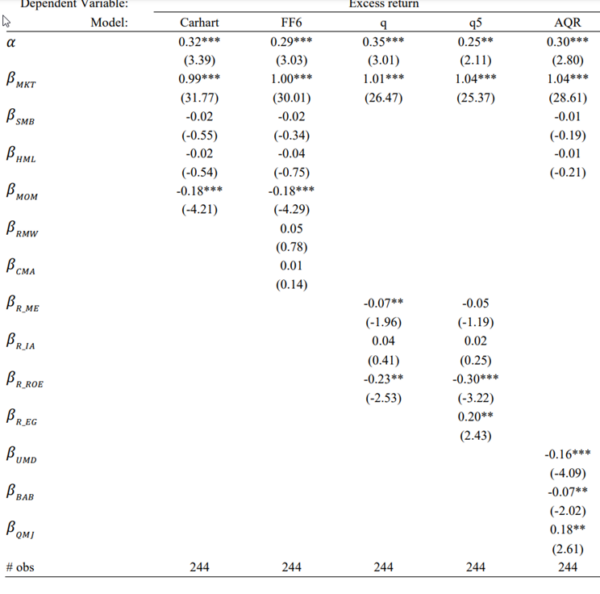
- As shown in the table above, the BB portfolio had a negative and significant exposure to the momentum factor (MOM in Carhart and FF6, and UMD in AQR), and the loadings on the profitability factor in the q-models were negative (ROE). The BB portfolio had a positive and significant loading on the quality factor of the AQR model (QMJ) and the expected growth factor of the q-5 model (R_EG). (The latter is constructed based on operating cash flow and implicitly measures the effect of intangible investments because it includes R&D expenditures, suggesting that it is important to control for newer factors, in particular profitability and quality, since BBs tend to be high-quality companies.)
- The excess returns were robust across various factor models—they were not driven by exposures to known factors such as size, value, momentum, profitability, quality, or expected growth, nor were they driven by microcap stocks—a value-weighted BB portfolio earned significant abnormal returns.
Indexes are unmanaged, do not reflect management or trading fees, and one cannot invest directly in an index.
- There was no evidence that the excess returns were disappearing. Nor was there evidence that the excess returns were due to industry composition or small-cap stocks (there was no BB with a size below the NYSE 30th percentile in any single year). And the results were robust to excluding (controlling for) companies in the computer software industry.
- Investing in an initial BB list and not updating the portfolio led to lower returns than rebalancing the portfolio according to the most current list—membership among the best brands is not a permanent characteristic, and updates of BB listings contain useful information—on average, three new brands enter the list each year and two brands leave the list, presumably due to negative shocks to the brand value. Thus, a portion of the abnormal returns to the BB portfolio comes from the yearly rebalancing of the BB portfolio that removes (includes) the brands that have lost (gained) significant value since the year before.
- The results were robust to subperiod samples.
Their findings led Boustanifar and Kang to conclude that their results:
“strongly suggest that the BB portfolio generates a positive, sizable, and statistically significant excess return, after controlling for common (risk) factors including size, value, momentum, profitability, quality, and expected growth. It is important to highlight that these excess returns are above and beyond any positive short-term market reaction to the BB list announcement due to the fact that the BB portfolio is formed several weeks after the list announcement to allow for the market to price in the news.”
Thus, they observed:
“The market does not fully incorporate the value of brands and this is the case particularly when the brand is developed internally, as its value would be completely missing from the balance sheet. We also provide evidence that analysts tend to underestimate the benefits of brand names in generating future earnings.”
The authors’ findings are consistent with those of Thomas Madden, Frank Fehle, and Susan Fournier, authors of the 2002 study “Brands Matter: An Empirical Demonstration of the Creation of Shareholder Value Through Brands.” They are also consistent with those of Kai Wu, author of the 2021 study “Brand in the Influencer Era.” Wu found that over the prior decade a strong brand strategy produced consistent outperformance. He concluded:
“Strong brands are a deep moat that affords firms greater pricing power, sales volume, and customer loyalty. Furthermore, the robust historical performance of the factor implies that the market does not fully recognize the value of this powerful but intangible asset.”
Investor Takeaways
The ability to interpret financial statements has been complicated by the dramatic shift from tangible investments (such as plant and equipment) to intangible investments (such as R&D, advertising (branding), and expenses related to human capital). Given the shift in expenditures, it should not be a surprise that researchers, including the authors of the 2020 studies “Explaining the Recent Failure of Value Investing,” “Intangible Capital and the Value Factor: Has Your Value Definition Just Expired?” and “Equity Investing in the Age of Intangibles,” and the 2021 study “Value of Internally Generated Intangible Capital,” (read more here) have focused attention on the impact on equity valuations and returns resulting from the change in the relative importance of intangible assets compared to physical assets. The authors of these studies found that the increasing importance of intangibles, at least for industries with high concentrations of them, is playing an important role in the cross-section of returns. Thus, the role of intangibles should be addressed in portfolio construction because not accounting for them affects not only value metrics but other measures (e.g., profitability) that often scale by book value or total assets, both of which are affected by intangibles. One solution recommended and used by some investment management firms is to capitalize the investments that appear on the income statement and amortize them over their useful lives. This means treating an intangible investment the same as a tangible investment. However, that raises questions such as: Which income statement items are appropriately considered investments? And what is a proper useful life for those assets? Research continues to try to identify the best method of addressing these questions. I summarized the latest findings in my May 3, 2022, article for The Evidence Based Investor.
The findings of the studies discussed support the view that the market may be undervaluing branding—while companies invest billions to build brand equity, this intangible asset does not appear on balance sheets. In his paper, Wu did note that the accounting professionʼs decision to not capitalize brand investment is not completely without merit because efforts to build brand equity can produce a wide range of potential outcomes. However, he noted that:
“in the influencer era, the nexus of consumer power has migrated online. It has moved to the very domain that is the most fertile ground for NLP natural language processing] and other modern data analysis techniques. With the exponential growth in user-generated data, investors are better positioned than ever to quantify this important intangible asset.”
Finally, some words of caution are warranted. First, as noted above, a challenge with using the Interbrand rankings is that they are highly biased toward large companies because they are based on the absolute brand value (as opposed to relative to market cap). Second, another challenge is the relatively small sample size (on average, 47 at each point in time). With that in mind, their results—strong brands do outperform net of standard factors/industries—are supportive of the broader thesis that the value of intangibles provides information as to the cross-section of returns. Third, as mentioned, while BBs spent 11.92 percent of their gross profit on advertising, this varies significantly (Accenture vs. Nike). This is an important point, as it underscores the weakness of the traditional approach of capitalizing SG&A (selling, general and administrative expenses)—there is a weak link between historical investment and the resulting brand value, as ad campaigns can go viral or flop. Thus, while imperfect, the use of brand valuations is merited because it at least tries to determine the actual resulting value (as opposed to historical investment).
Postscript: Thanks to Andrew Berkin, head of research at Bridgeway Capital Management, and Kai Wu, chief investment officer of Sparkline Capital, for their insightful comments and suggestions.
Disclosures
For informational and educational purposes only and should not be construed as specific investment, accounting, legal, or tax advice. Certain information is based upon third-party data which may become outdated or otherwise superseded without notice. Third-party information is deemed to be reliable, but its accuracy and completeness cannot be guaranteed. By clicking on any of the links above, you acknowledge that they are solely for your convenience, and do not necessarily imply any affiliations, sponsorships, endorsements or representations whatsoever by us regarding third-party websites. We are not responsible for the content, availability or privacy policies of these sites, and shall not be responsible or liable for any information, opinions, advice, products or services available on or through them. The opinions expressed by featured authors are their own and may not accurately reflect those of Buckingham Strategic Wealth® or Buckingham Strategic Partners®, collectively Buckingham Wealth Partners. Neither the Securities and Exchange Commission (SEC) nor any other federal or state agency have approved, determined the accuracy, or confirmed the adequacy of this article. LSR-22-324
About the Author: Larry Swedroe
—
Important Disclosures
For informational and educational purposes only and should not be construed as specific investment, accounting, legal, or tax advice. Certain information is deemed to be reliable, but its accuracy and completeness cannot be guaranteed. Third party information may become outdated or otherwise superseded without notice. Neither the Securities and Exchange Commission (SEC) nor any other federal or state agency has approved, determined the accuracy, or confirmed the adequacy of this article.
The views and opinions expressed herein are those of the author and do not necessarily reflect the views of Alpha Architect, its affiliates or its employees. Our full disclosures are available here. Definitions of common statistics used in our analysis are available here (towards the bottom).
Join thousands of other readers and subscribe to our blog.