It is well documented in the literature that over the long term, low-investment firms have outperformed high-investment firms—with the negative relation between asset growth (AG) and future stock returns particularly featured by the overvaluation of high AG stocks. This finding has led to the investment factor (CMA, or conservative minus aggressive) being incorporated into the leading asset pricing models—the q-factor model (market beta, size, investment and profitability), the Fama-French five-factor model (beta, size, value, investment and profitability) and the Fama-French six-factor model that adds momentum.
Both behavioral and rational explanations have been offered for the AG premium. Behavioral explanations include overinvestment (due to empire-building behavior) and limits to arbitrage that prevent sophisticated investors from correcting mispricings caused by investors who excessively extrapolate past growth when valuing firms. In their paper “Digesting Anomalies: An Investment Approach,” Kewei Hou, Chen Xue and Lu Zhang provided the rational explanation: Firms with lower discount rates (lower costs of capital and thus lower expected returns) invest more. Firms with higher discount rates (higher costs of capital and thus higher expected returns) face higher hurdles for investment and thus invest less. In other words, investment predicts returns because, given expected profitability, high costs of capital imply low net present value of new capital and low investment, and low costs of capital imply high net present value of new capital and high investment. Thus, all else equal, firms with higher investment should earn lower expected returns than firms with lower investment.
In addition, valuation theory predicts that, controlling for a firm’s market value and expected profitability, a company that must invest heavily to sustain its profits should have lower contemporaneous free cash flows to investors than a company with similar profits but lower investment. This is what Eugene Fama and Ken French found in their 2004 paper “Profitability, Growth, and Average Returns.” They also found that while there is not a direct way to measure future investment, recent asset growth is a reliable proxy for expected investment, allowing them to measure the effect. Their findings were confirmed by the research team at Dimensional in their October 2019 paper “Investment and Expected Stock Returns” in which they found that the AG factor was persistent and pervasive around the globe and stronger in smaller cap stocks.
New Research
Jing Lu, Nien-Tzu Yang, Keng-Yu Ho and Kuan-Cheng Ko, authors of the study “Lottery Demand and the Asset Growth Anomaly,” published in the August 2022 issue of Finance Research Letters, proposed another explanation for the poor performance of high AG firms—overvaluation is attributed to investors’ lottery demand toward stocks with high maximum daily returns (MAX), resulting in a higher AG premium among high MAX stocks. Academic research, including the studies, “Do Investors Overpay for Stocks with Lottery-like Payoffs? An Examination of the Returns on OTC Stocks,” “Lottery Preference and Anomalies” and “Do the Rich Gamble in the Stock Market? Low Risk Anomalies and Wealthy Households,” has found that there are investors who have a “taste,” or preference, for lottery-like investments—those that exhibit positive skewness and excess kurtosis. This leads them to irrationally (from a traditional finance perspective) invest in high-volatility stocks (which have lottery-like distributions), driving their prices higher, resulting in poor returns.
Lu, Yang, Ho and Ko established the linkage between AG and lottery preference based on the salience theory that salient or lottery-like payoffs attract more attention from investors. Because extremely high AG and lottery preference could both be attention-grabbing features to investors, they posited that investors’ trading preference and overvaluation are enhanced when stocks exhibit both extreme AG rates and lottery-like payoffs. This led to their main hypothesis that the AG anomaly is strengthened when high AG stocks exhibit stronger lottery-like payoffs. They used the maximum daily return over the past month (MAX) as the measure of investors’ lottery preference because extreme past return represents a form of lottery-like payoff. The MAX metric is from Turan Bali, Nusret Cakici and Robert Whitelaw’s 2008 study “Maxing Out: Stocks as Lotteries and the Cross-Section of Expected Returns.” They found a negative and significant relationship between the maximum daily return over the past month and expected stock returns.
In calculating excess returns, Lu, Yang, Ho and Ko controlled for the Carhart four factors (beta, size, value and momentum) and the Fama-French five factors (beta, size, value, investment and profitability). Their sample covered U.S. stocks over the period July 1963-December 2016. Applying a double-sorting portfolio approach, they found:
- Higher AG firms tended to have larger market capitalizations, lower book-to-market ratios and lower past returns than lower AG firms.
- There was a significant AG premium, -1.506 percent (-0.748 percent) per month under equal (value) weights.
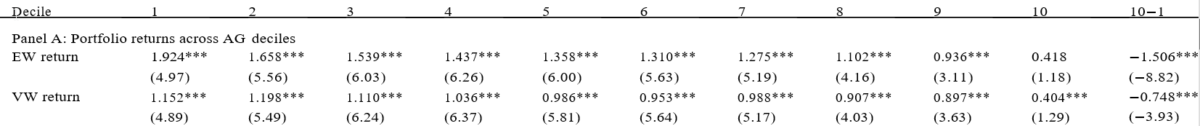
- The AG premium remained negative and significant under risk adjustments using either Carhart’s four-factor model or Fama and French’s five-factor model.
The return difference between high and low AG stocks was significantly negative for the highest MAX quintile while insignificant for the lowest MAX quintile—demonstrating the importance of investors’ lottery preference in explaining the AG anomaly.
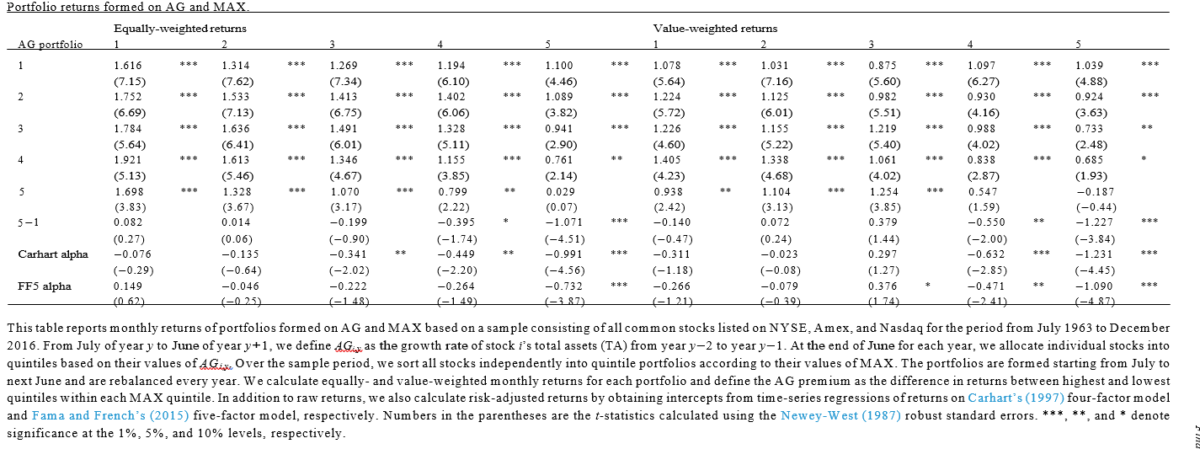
- The premium between high and low MAX quintile portfolios exhibited a monotonically decreasing pattern as AG increased, indicating that investors not only have a preference for stocks with extreme past performance but also view high AG stocks favorably. As a result, their lottery preferences are strengthened when lottery-like stocks experienced extremely high AG in the past, leading to greater willingness to bid up the price for such stocks.
- Consistent with the lottery preference hypothesis, the findings were strong for low-priced stocks—low price represents a lottery feature that attracts gamblers.
Their findings led Lu, Yang, Ho and Ko to conclude that
“overvaluation is attributed to investors’ lottery demand toward stocks with high maximum daily returns (MAX), resulting in higher AG premium among high MAX stocks. … Further evidence indicates that the impact of lottery preference on the AG anomaly is robust to several alternative explanations, including overinvestment, limits-to-arbitrage, and the q-theory. Our study provides a new insight into the understanding of the AG anomaly.”
Investor Takeaways
The source of the AG anomaly has been debated in the literature, with prior research positing three explanations for this anomaly: the behavioral explanations of overinvestment and limits to arbitrage, and the economically rational explanation provided by q-theory. Lu, Yang, Ho and Ko provided a new insight: investors’ lottery preference, providing robust evidence showing that the AG premium is stronger for high MAX stocks than for low MAX stocks.
Note that fund families whose investment strategies are based on academic research, such as Alpha Architect, AQR, Bridgeway and Dimensional Fund Advisors, have long excluded from their eligible universe stocks with lottery characteristics. For investors, the takeaway is that an efficient way to improve the expected performance of an equity strategy might be to systematically exclude firms (especially small firms) with high asset growth and extreme past returns, especially if they have low profitability.
Disclaimers
For informational and educational purposes only and should not be construed as specific investment, accounting, legal, or tax advice. Certain information is based upon third party data and may become outdated or otherwise superseded without notice. Third party information is deemed to be reliable, but its accuracy and completeness cannot be guaranteed. By clicking on any of the links above, you acknowledge that they are solely for your convenience, and do not necessarily imply any affiliations, sponsorships, endorsements or representations whatsoever by us regarding third-party websites. We are not responsible for the content, availability or privacy policies of these sites, and shall not be responsible or liable for any information, opinions, advice, products or services available on or through them. The opinions expressed by featured authors are their own and may not accurately reflect those of Buckingham Strategic Wealth® or Buckingham Strategic Partners®, collectively known as Buckingham Wealth Partners. Neither the Securities and Exchange Commission (SEC) nor any other federal or state agency have approved, determined, or confirmed the adequacy of this article. LSR-22-368
About the Author: Larry Swedroe
—
Important Disclosures
For informational and educational purposes only and should not be construed as specific investment, accounting, legal, or tax advice. Certain information is deemed to be reliable, but its accuracy and completeness cannot be guaranteed. Third party information may become outdated or otherwise superseded without notice. Neither the Securities and Exchange Commission (SEC) nor any other federal or state agency has approved, determined the accuracy, or confirmed the adequacy of this article.
The views and opinions expressed herein are those of the author and do not necessarily reflect the views of Alpha Architect, its affiliates or its employees. Our full disclosures are available here. Definitions of common statistics used in our analysis are available here (towards the bottom).
Join thousands of other readers and subscribe to our blog.