Abstract: In times of extreme macroeconomic events, including war, hyperinflation, or significant economic recessions, many investors believe gold investing is a safe haven. Is that belief warranted?
Investors have concerns about the increased risks of inflation and a recession, Congress’ ability to increase the debt limit (failing to do so could lead to a default on government debt), and the many geopolitical risks markets are addressing (including the ongoing war in Ukraine and heightened tensions with China). So, it’s not surprising that as head of financial and economic research at Buckingham Wealth Partners, I’ve received calls from clients inquiring about moving assets to gold. When I asked them why they were considering it, three reasons dominated:
Are these valid reasons? As always, we look to the historical evidence to provide the answers.
In their June 2012 study, “The Golden Dilemma,” Claude Erb and Campbell Harvey examined those issues. In terms of being a currency hedge, they found that the change in the real price of gold was largely independent of the change in currency values. In other words, gold is not a good hedge against currency risk.
As for gold serving as a safe haven, meaning it is stable during bear markets in stocks, Erb and Harvey found gold isn’t quite the safe haven, some might think. As it turned out, 17 percent of monthly stock returns fell into the category where gold dropped while stocks posted negative returns. If gold acts as a true safe haven, we would expect very few, if any, such observations. Still, 83 percent of the time on the right side isn’t a bad record. With that said, even the safe-haven hypothesis was tarnished, as gold prices declined over 30 percent during the worst of the financial crisis—when the hedge was needed most, it failed. In 2022 when stocks and bonds produced double-digit losses, even though gold outperformed stocks and bonds, it failed to provide a true hedge, as it fell slightly, closing at $1,824 in 2022 after closing at $1,829 in 2021.
In terms of gold’s value as an inflation hedge, the following example should help provide an answer. On January 21, 1980, the price of gold reached a then-record high of $850. On March 19, 2002, gold was trading at $293, well below its price 20 years earlier. The inflation rate for the period from 1980 through 2001 was 3.9 percent. Thus, gold’s loss in real purchasing power was about 85 percent. How is gold an inflation hedge when it lost 85 percent in real terms over 22 years?
Here’s an example with an even more extended period. As seen in the chart below, with gold now trading at around $2,000, it has lost more than 20 percent of its real value (inflation-adjusted) from its peak of about $2,533 in February 1980. That’s more than 42 years with a significant loss in real value.
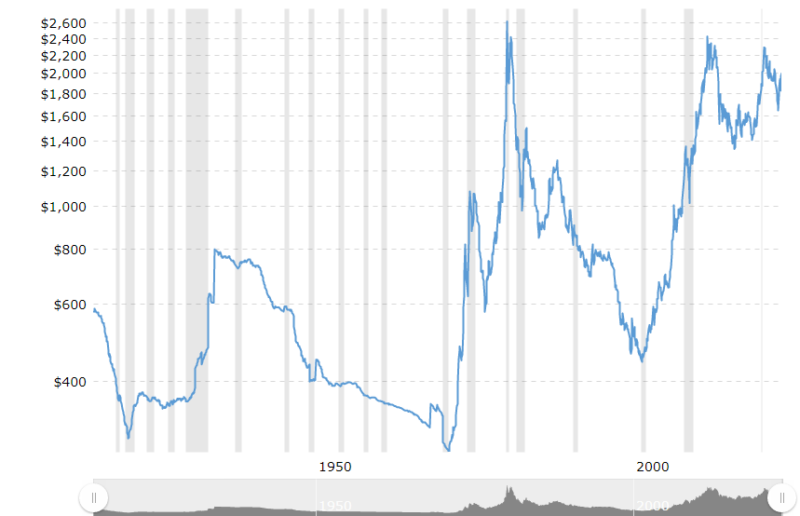
The results are hypothetical results and are NOT an indicator of future results and do NOT represent returns that any investor actually attained. Indexes are unmanaged and do not reflect management or trading fees, and one cannot invest directly in an index.
Their analysis led Erb and Harvey to conclude that although there is little relation between the nominal price of gold and inflation when measured over even 10‐year periods, the evidence suggests that gold does hold its value over the very long run. For example, in their 2019 update to “The Golden Constant,” they presented historical evidence that the wage of a Roman centurion (in gold) was approximately the same as the pay a U.S. Army captain earned today. They also showed that the price of bread (again in gold) thousands of years ago was about the same as we would pay today at an upscale bakery.
As additional evidence that gold is not a good hedge against inflation, Goldman Sachs’ “2013 Outlook” included the following finding: During the post-World War II era, in 60 percent of episodes when inflation surprised to the upside, gold underperformed inflation. That said, gold has been a good inflation hedge over the very long run (such as a century). Unfortunately, that’s a much longer horizon than that of most investors.
Pim van Vliet and Harald Lohre contribute to the literature on gold with their April 2023 study, “The Golden Rule of Investing,” in which they examined the strategic role of gold in investment portfolios, focusing on its marginal downside risk-reduction benefits relative to bonds and equities. They also considered longer horizons and accounted for inflation. They extended Erb and Harvey’s analysis to include ten more years, covering the period from 1975 (when gold became truly tradable) through 2022. Following is a summary of their key findings:
- Equities and gold jointly declined in 17 percent of the months. Conversely, equities were down, and gold was up in 19 percent of the months, roughly resonating with a 50/50 chance for gold to show negative returns in a given negative equity month—gold is not a perfect safe haven when evaluated at a one-month horizon.
- At the three-year horizon, gold would have served as a safe haven in about three-quarters of down markets for equities—again, not a perfect safe haven. In addition, the somewhat limited protection came at a clear cost because gold was down half of the times when equities were up.
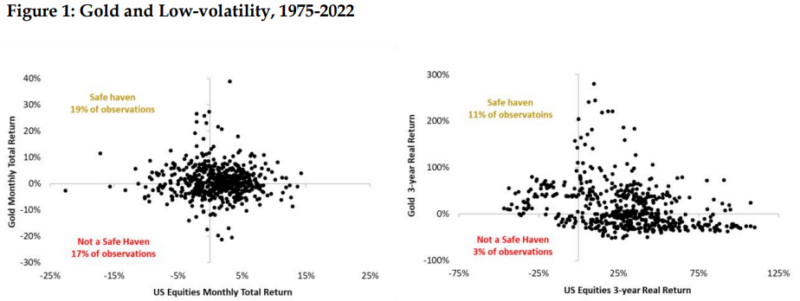
The results are hypothetical results and are NOT an indicator of future results and do NOT represent returns that any investor actually attained. Indexes are unmanaged and do not reflect management or trading fees, and one cannot invest directly in an index.
Van Vliet and Lohre next examined the effectiveness of gold in lowering downside risk over the period 1975-2022. They found:
- The real returns for equities (CRSP total market), bonds (10-year Treasuries), and gold were 8.0 percent, 3.3 percent, and 1.5 percent, respectively.
- The risk of gold was high on a stand-alone basis—its downside volatility was 11.3 percent compared to 7.9 percent for equities and 5.3 percent for bonds.
- The Sortino ratio, which measures the return per unit of downside volatility, was 1.01 for equities, 0.62 for bonds, and only 0.13 for gold.
- Judging by the loss probability over a one-year horizon, gold was riskier (49.7 percent chance of loss) than both equities (24.9 percent chance of loss) and bonds (34.6 percent chance of loss). Notably, bonds had a greater probability of loss than equities, though lower than that of gold.
- Judging by the expected loss over a one-year horizon, gold was riskier (-6.1 percent) than both equities (-3.1 percent) and bonds (-2.5 percent).
- Judging by the minimum return over a one-year horizon, gold was riskier (-46.1 percent) than both equities (-42.2 percent) and bonds (-25.3 percent).
When van Vliet and Lohre examined adding an increasing allocation of gold to a traditional stock and bond portfolio (with annual rebalancing), they found very little evidence of any real net benefits. For example, while adding a small allocation to gold (5-10 percent) slightly reduced downside volatility (from 3.9 percent to 3.7 percent), slightly improved the Sortino ratio (from 1.56 to 1.61), reduced the probability of loss (from 26.6 percent to 22.4 percent) and the expected loss (from 1.6 percent to 1.3 percent), it also reduced the real return from 6.1 percent to 5.9 percent. They also found that increasing the gold allocation to above 10 percent generally led to even lower real returns and increased downside risk as well.
Their findings led van Vliet and Lohre to conclude: “Our empirical study corroborates that a portfolio’s loss probability, its expected loss, and downside volatility can be brought down with modest allocations (5-10%) to gold. However, hedging downside risk via gold investing comes at the cost of lower return.”
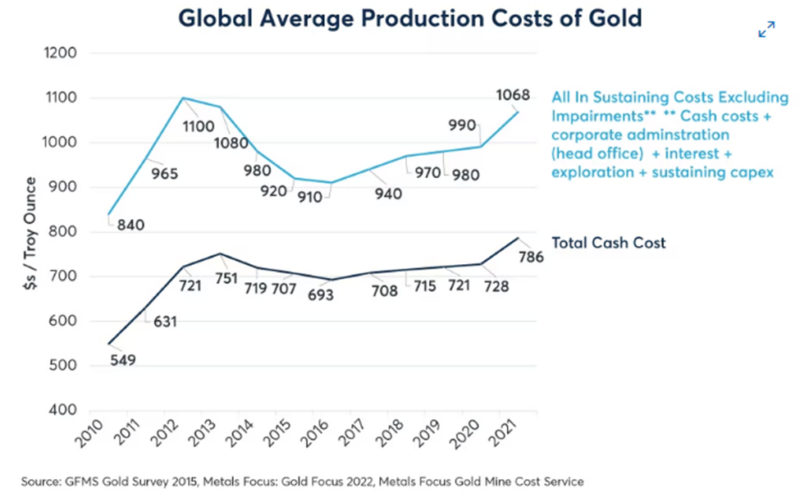
While the laws of economics can be defied in the short term, history demonstrates that investors ignore them at their peril. For instance, a basic economic principle is that over the long term, prices tend to move toward the marginal cost of production. The following table shows that with gold trading at around $2,000, mining remains an extremely profitable activity—making a strong case for investment which would increase supply (a negative impact on price without an offsetting increase in demand). That said, there may be environmental and political reasons to defer investing in the sector, and high current profit margins do not necessarily imply that we will see increased investment. In addition, even amid increased investment, there may not be a strong rebound in gold production for many years given the time required to begin extracting ore from new mines.
Investor Takeaways
Investors are often attracted to gold because they believe it provides hedging benefits—hedging inflation, hedging currency risk, and acting as a haven of safety in bad times. The evidence suggests that investors should be wary. First, while gold might protect against inflation in the very long run, 10 or 20 years is not the long run. And there is no evidence that gold acts as a hedge against currency risk. As to being a safe haven, Erb and Harvey noted in their study: “In the shorter run, gold is a volatile investment which is capable and likely to overshoot or undershoot any notion of fair value.” Evidence of gold’s short-term volatility is that over the 17-year period 2006-2022, the annual standard deviation of the iShares Gold Trust ETF (IAU), at 17.2 percent, was higher than the 15.6 percent annual standard deviation of Vanguard’s 500 Index Investor Fund (VFINX). In addition, it experienced a maximum drawdown of almost 43 percent—safe havens don’t experience losses of that magnitude.
With that said, there have been periods when gold did act as a safe haven, just not reliably. In other words, it cannot be considered portfolio insurance because insurance is always there when needed. Investors seeking to diversify their portfolios away from the risks of traditional stocks and bonds should consider other assets that have low correlations to stocks and bonds but have higher expected (though not guaranteed) real returns. Examples include reinsurance funds (such as SRRIX, SHRIX, and XILSX), private, senior secured, sponsored (by leading private equity firms) floating rate credit funds (CCLFX), and AQR’s style and risk premium funds (QSPRX and QRPRX). Individuals looking to diversify their portfolio with reinsurance funds should be aware of the risks, including liquidity risk, and should speak with their financial advisor prior to potentially implementing them in their portfolio.
Larry Swedroe is head of financial and economic research for Buckingham Wealth Partners.
For informational and educational purposes only and should not be construed as specific investment, accounting, legal, or tax advice. Certain information is based on third party data and may become outdated or otherwise superseded without notice. Mentions of specific securities should not be construed as a specific recommendation. Third party information is deemed to be reliable, but its accuracy and completeness cannot be guaranteed. By clicking on any of the links above, you acknowledge that they are solely for your convenience, and do not necessarily imply any affiliations, sponsorships, endorsements or representations whatsoever by us regarding third-party websites. We are not responsible for the content, availability or privacy policies of these sites, and shall not be responsible or liable for any information, opinions, advice, products or services available on or through them. Neither the Securities and Exchange Commission (SEC) nor any other federal or state agency have approved, determined the accuracy, or confirmed the adequacy of this article. LSR-23-481
About the Author: Larry Swedroe
—
Important Disclosures
For informational and educational purposes only and should not be construed as specific investment, accounting, legal, or tax advice. Certain information is deemed to be reliable, but its accuracy and completeness cannot be guaranteed. Third party information may become outdated or otherwise superseded without notice. Neither the Securities and Exchange Commission (SEC) nor any other federal or state agency has approved, determined the accuracy, or confirmed the adequacy of this article.
The views and opinions expressed herein are those of the author and do not necessarily reflect the views of Alpha Architect, its affiliates or its employees. Our full disclosures are available here. Definitions of common statistics used in our analysis are available here (towards the bottom).
Join thousands of other readers and subscribe to our blog.