This article discusses the Robust Asset Allocation (RAA) index, a dynamic algorithm we have developed.
Robust: capable of performing without failure under a wide range of conditions
The Investor’s Dilemma
Many investors face a fundamental problem: What should I do with my money?
People usually pursue one of four broad solutions to this problem:
- Hire an expensive investment advisor that invests in overpriced active management.
- Hire an affordable advisor that invests in what amounts to a 60/40-ish portfolio.
- Hire a cheap robo-advisor that invests in what amounts to a 60/40-ish portfolio.
- Hire an affordable advisor that invests in something different than the 60/40-ish portfolio.
Option #1 (hire an expensive investment advisor) is clearly a bad idea, but the options #2, #3, and #4 are all worth consideration.
As far as option #2 (hire an affordable advisor), plenty of affordable, honest, independent advisors charge reasonable prices for the value they deliver. You’ll probably get a portfolio that mirrors a 60/40-ish portfolio, but you’ll also have access to financial planning, behavioral coaching, and peace of mind (~50-125bps all-in).
Option #3 (hire a cheap robo-advisor) is interesting as well, and there are plenty of dirt-cheap automated options that may not deliver the peace of mind a human advisor can deliver (at least not yet), but they also don’t charge that much for their 60/40-ish options. (~30-60bps all-in).
Finally, option #4 (hire an affordable advisor that invests in something different than the 60/40-ish portfolio) is also reasonable if the differentiated investment approach is affordable and better at helping an investor achieve an investment goal relative to the 60/40-ish portfolio (~50-200bps all-in).
Options #2 and #3 are probably best for a wide swath of financial consumers, but option #4 is certainly interesting for those with specialized investment goals and sound discipline. Option #4 is the topic of this piece.
(1)A 60/40-ish Portfolio Isn’t Gonna Cut it For My Situation. What Should I do?
First, we recommend all investors trying to tackle the, “What should I do with my money?” question, grab a copy of our book DIY Financial Advisor, which outlines the concepts discussed in this post but in much greater detail. The book will prepare you with the knowledge to ask the right questions if you are interviewing financial advisors and/or it will give you the necessary tools to be a successful Do-It-Yourself investor.
(2)
Okay, so you’ve powered through the DIY book or punted on that option since you’d instead just read this blog post. Either way, you are faced with an investment decision and you consider the following:
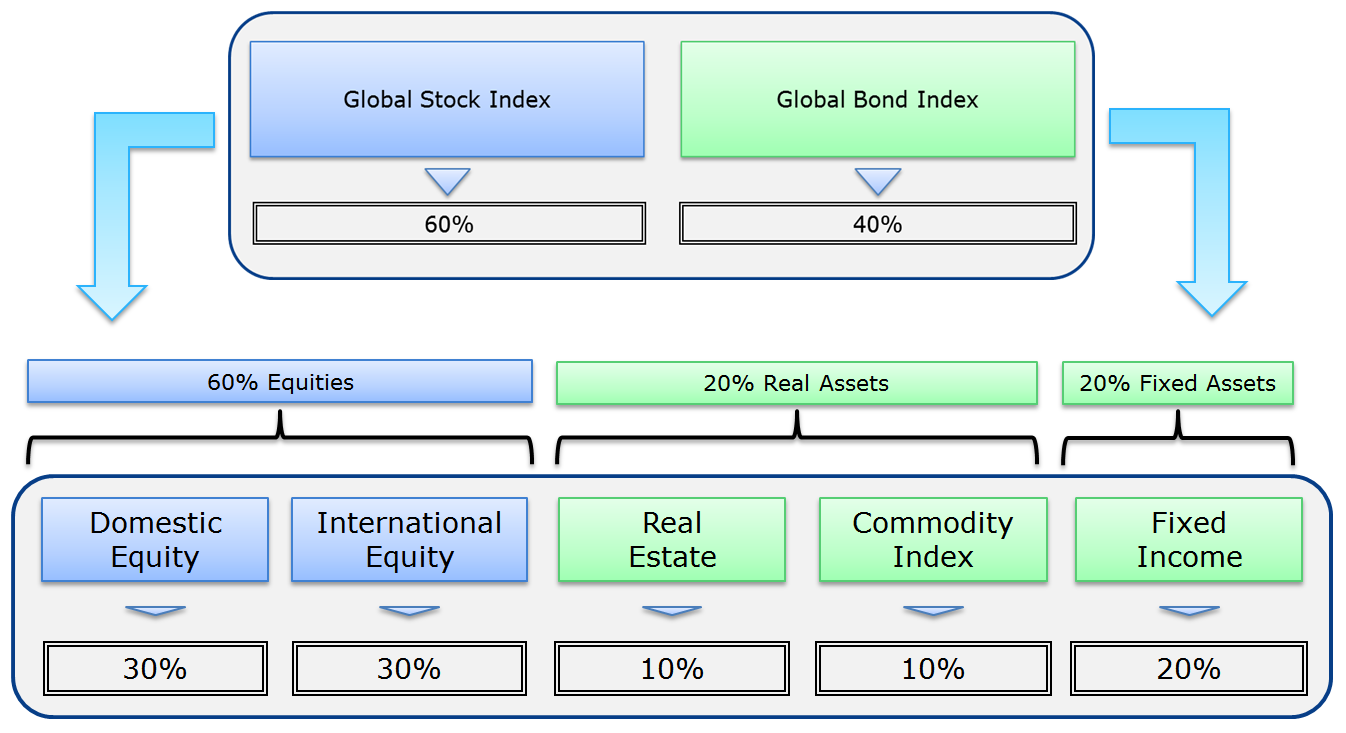
Easiest solution: 60% global equity; 40% global bond (or your own special weights depending on individual circumstances).
- Cheap. Easy.
- A reasonable approach. Totally DIY-able.
- This is a personal question, but something one should always consider: Is this portfolio achieving your objectives?

Easy solution:
Meb Faber and Eric Richardson (RIP) in their book, The Ivy Portfolio, hint at a do-it-yourself model that is a simple portfolio that allocates across US equity, developed equity, REITs, commodities, and US Treasury bonds. These 5 asset classes are commonly called the “IVY 5,” since they form the basic building blocks for the endowments of the Ivy League schools and others. This can be a reasonable allocation to achieve some investor’s goals. We’ll discuss this framework and why it is an exciting starting point for those trying to achieve an objective that may differ from those blindly allocating to a generic 60/40 portfolio.
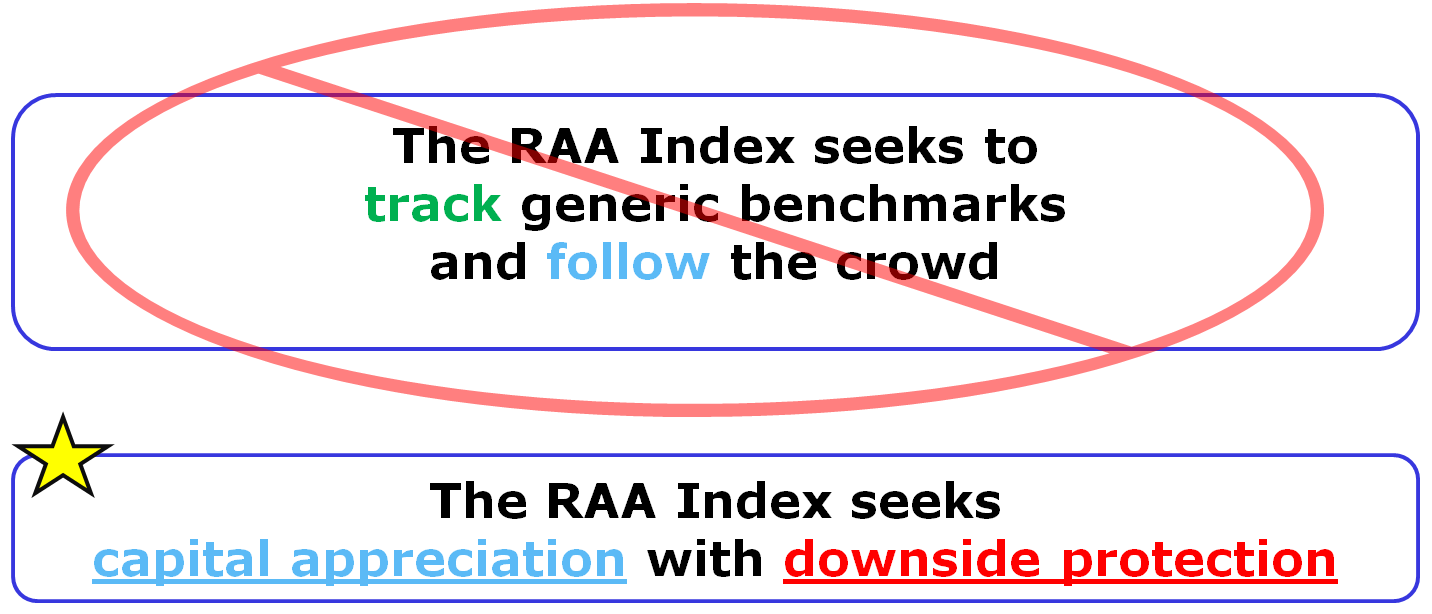
Robust Asset Allocation (RAA) Index:
The Robust Asset Allocation (RAA) Index is a dynamic algorithm we built with a specific goal: RAA seeks capital appreciation with downside protection. (3)

The tactical objectives of our RAA indexes are as follows:
- Portfolio growth that keeps up with inflation (principal growth)
- Downside protection (avoid large drawdowns)
- Superior tax efficiency (tax-savvy investing)
- Liquidity (facilitates flexibility)
Different investors have different objectives, but if your goal is to capture global asset returns, but at the same time you’d like to minimize the chance of a complete meltdown, our fully transparent RAA Indexes may be an interesting approach to explore.
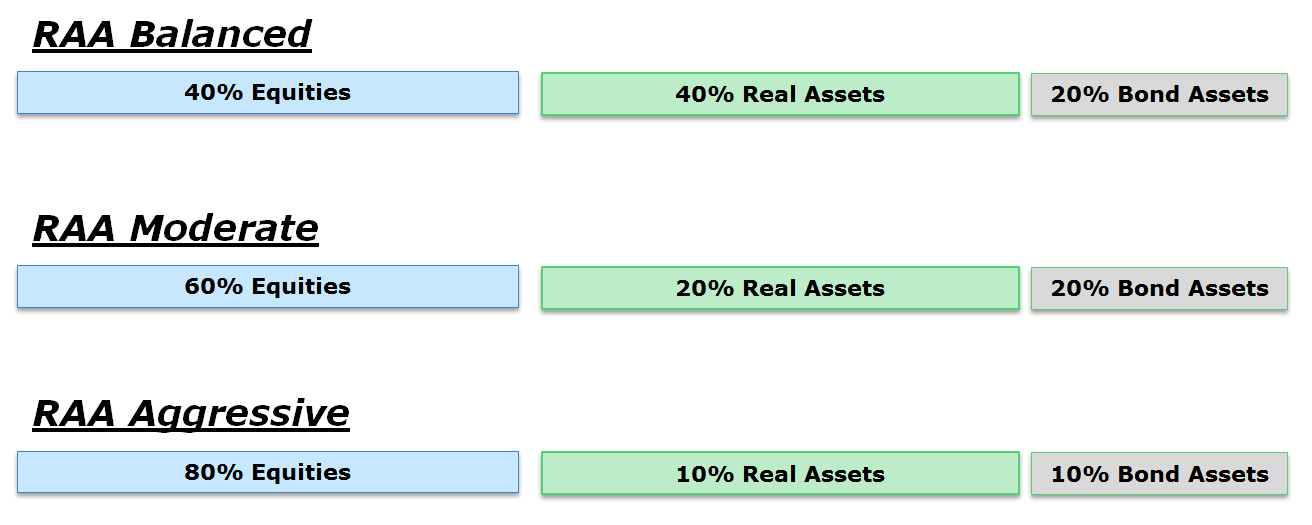
There are three flavors of the RAA Index — balanced, moderate, and aggressive.
Let’s start understanding the nuts and bolts of our RAA Indexes.
Core Premise: Financial Advice can be Simple and Effective
Our seed investor, who also happens to be a multi-billionaire and knows a lot more about investing than we could ever hope to achieve, has a great quote:
Wealth is built by concentrated holdings, but wealth is protected by diversification.
In short, if the goal is to get super rich, diversification and risk-management are arguably terrible ideas. A better idea is to concentrate on a single holding (i.e., build a business) and shoot for the stars. Of course, if your goal is to protect your wealth, diversification is a much more prudent approach. But there is no right answer. Goals are dependent on the investor and the specific objectives they want to achieve.
Once goals are established, we need financial advice to identify an investment solution that will achieve our goal. Remarkably, financial advice does not need to be complex to be effective. Our belief is based on a robust view of the evidence and my Marine Corps brainwashing to focus on having “brilliance in the basics.”
Complexity is often a smokescreen that hides a conflict of interest. For example, there are known incentives for financial firms to generate complexity in order to justify their existence. There are also well-established dangers associated with data-mining and whipping the data until it says what you want. Good financial advice should minimize both scenarios, if possible.
- Simple processes are less susceptible to data-mining.
- Simple processes are harder to disguise as black-box solutions that charge higher fees.
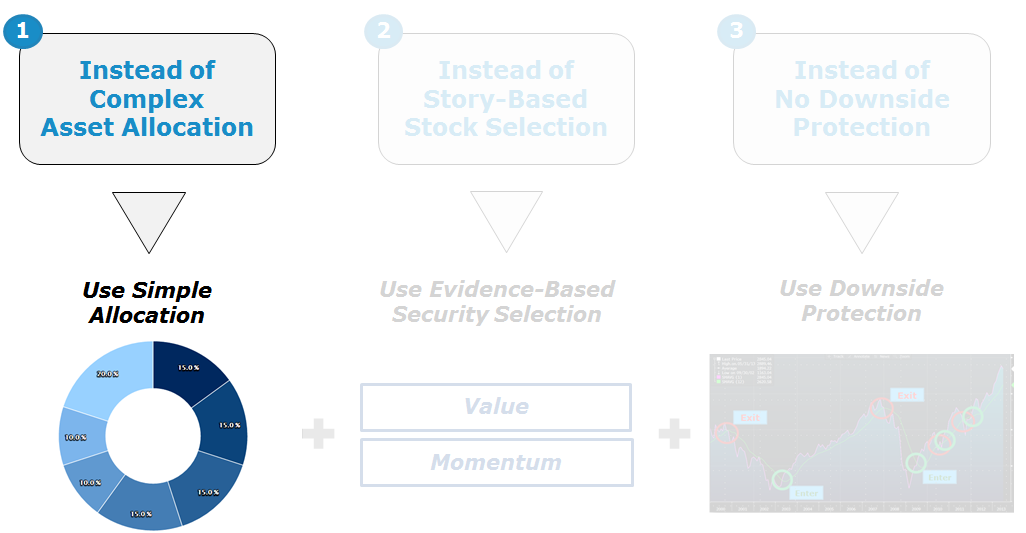
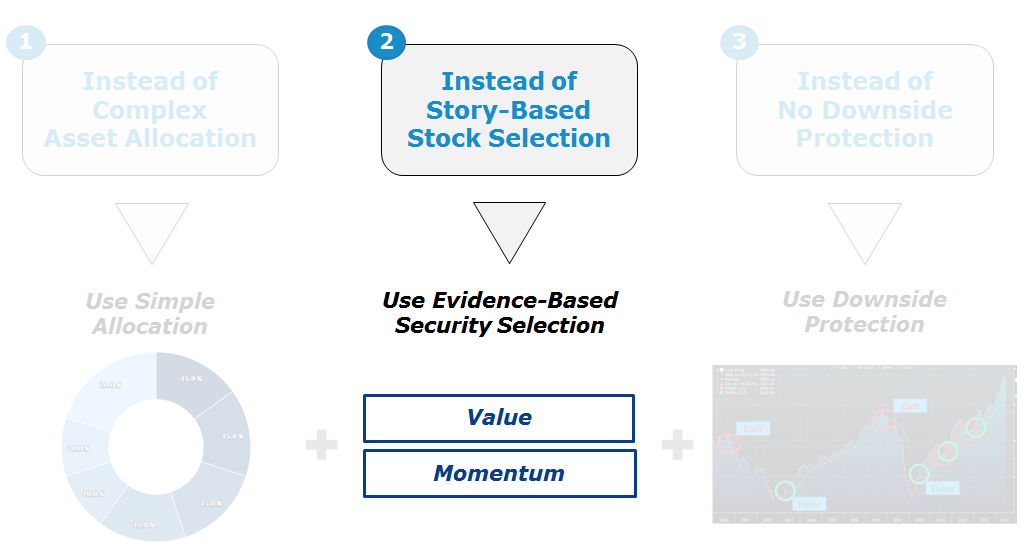
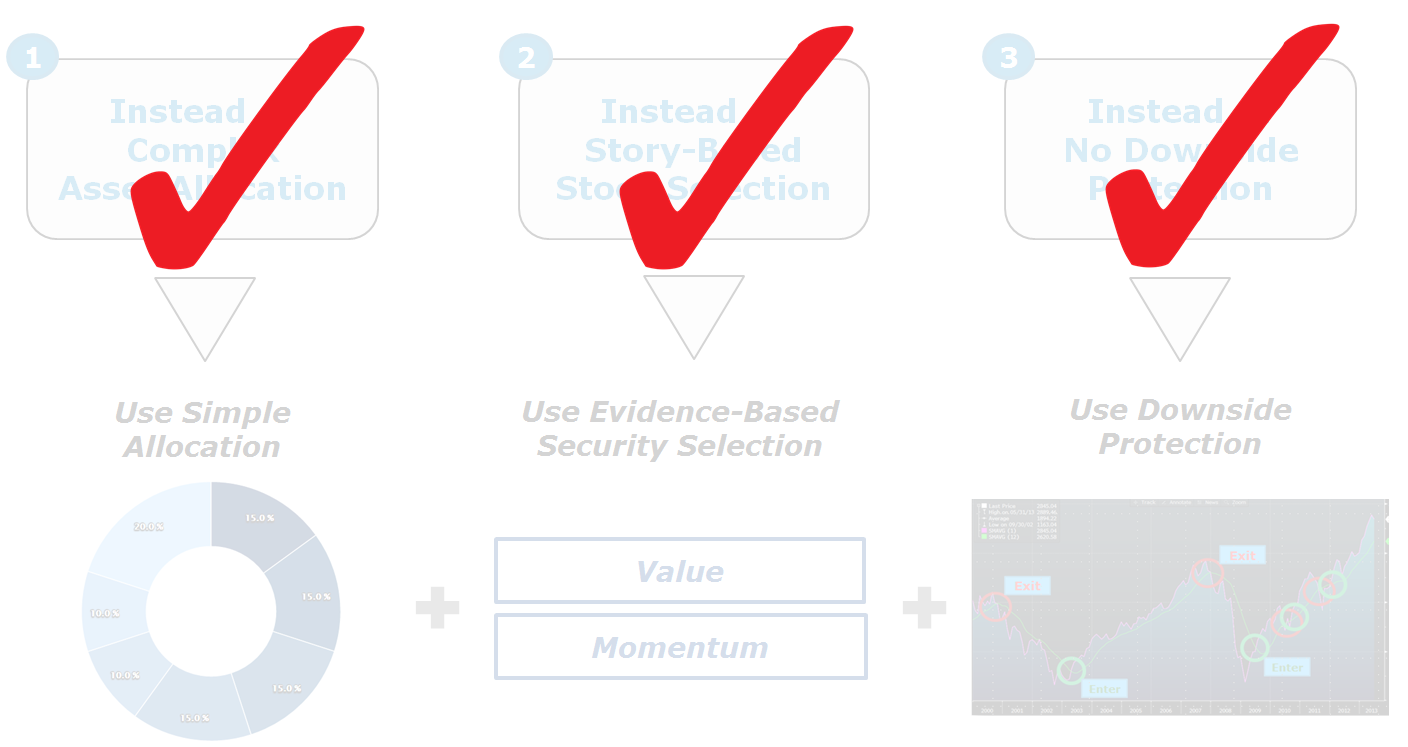
Three Elements of Simple and Effective Financial Advice
We break our discussion into three sections:
- Asset Allocation: Instead of complex asset allocation, use simple allocation.
- Security Selection: Instead of story-based stock selection, use evidence-based stock selection.
- Risk Management: Instead of buy-and-hold, use a downside-protection system.

Charts presented are for illustrative purposes only. Our downside protection models may not work in all situations and could fail to achieve their objectives.
Each of these elements form the building blocks of the Robust Asset Allocation Index, which we discuss in the following three sections.
#1 Asset Allocation: Instead of complex asset allocation, use simple allocation
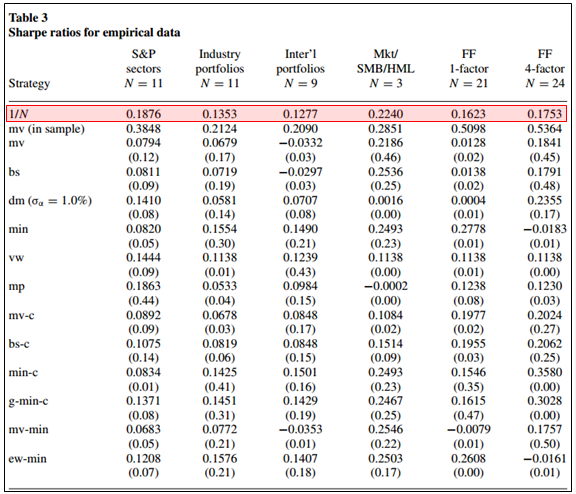
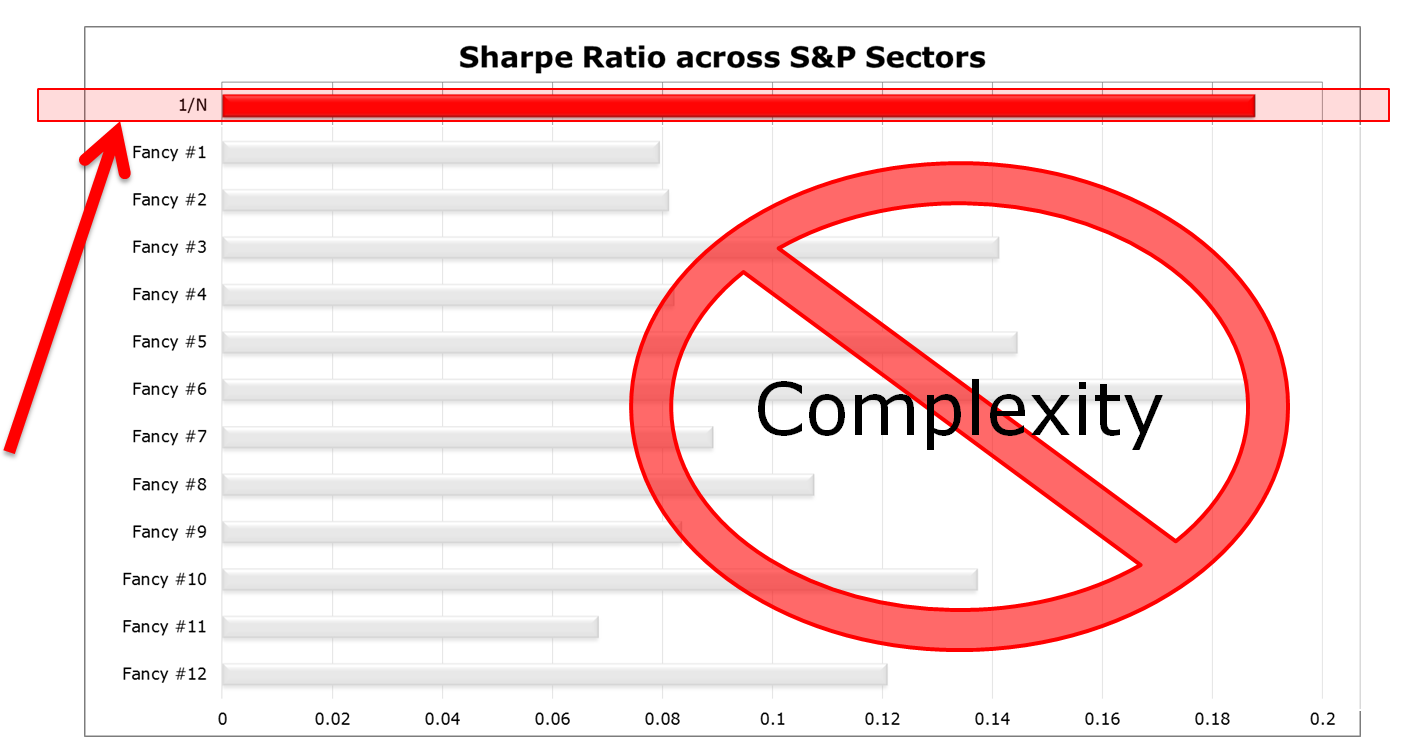
“Of the 14 models we evaluate across seven empirical datasets, none is consistently better than the 1/N rule…”
— DeMiguel, Garlappi and Uppal.
Victor DeMiguel and his colleagues have explored many sophisticated methodologies to optimize asset allocation. They have solutions that can possibly beat an equal-weight allocation, but these alternative solutions add a high degree of complexity. Prof. DeMiguel has an outstanding outline of data-driven investment management if you’d like to explore further. We’ve discussed the academic rationale for following a simple asset allocation model in the past, here, and here.
An equal-weight portfolio–also suggested by DeMiguel et al.–would seem to fly in the face of modern portfolio management, which in general has suggested that investors rely on mean-variance type allocation, or other highly engineered schemes. However, while mean-variance-analysis has reverse engineered the best historical Sharpe ratio (i.e. the tangency portfolio), this solution relies on a correlation matrix input, which is highly unstable and difficult to estimate. Indeed other approaches have this same weakness.(4)
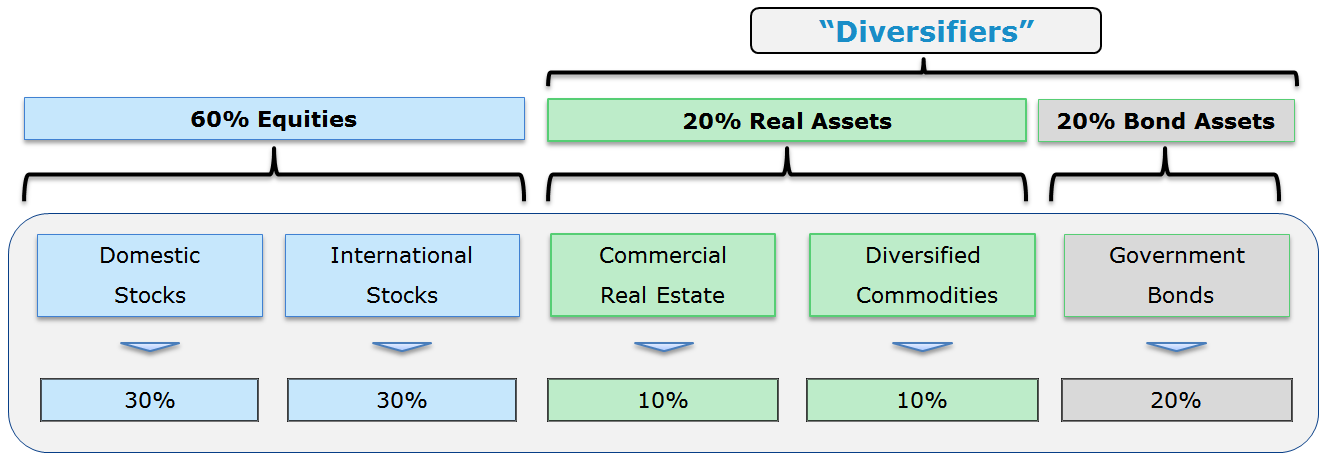
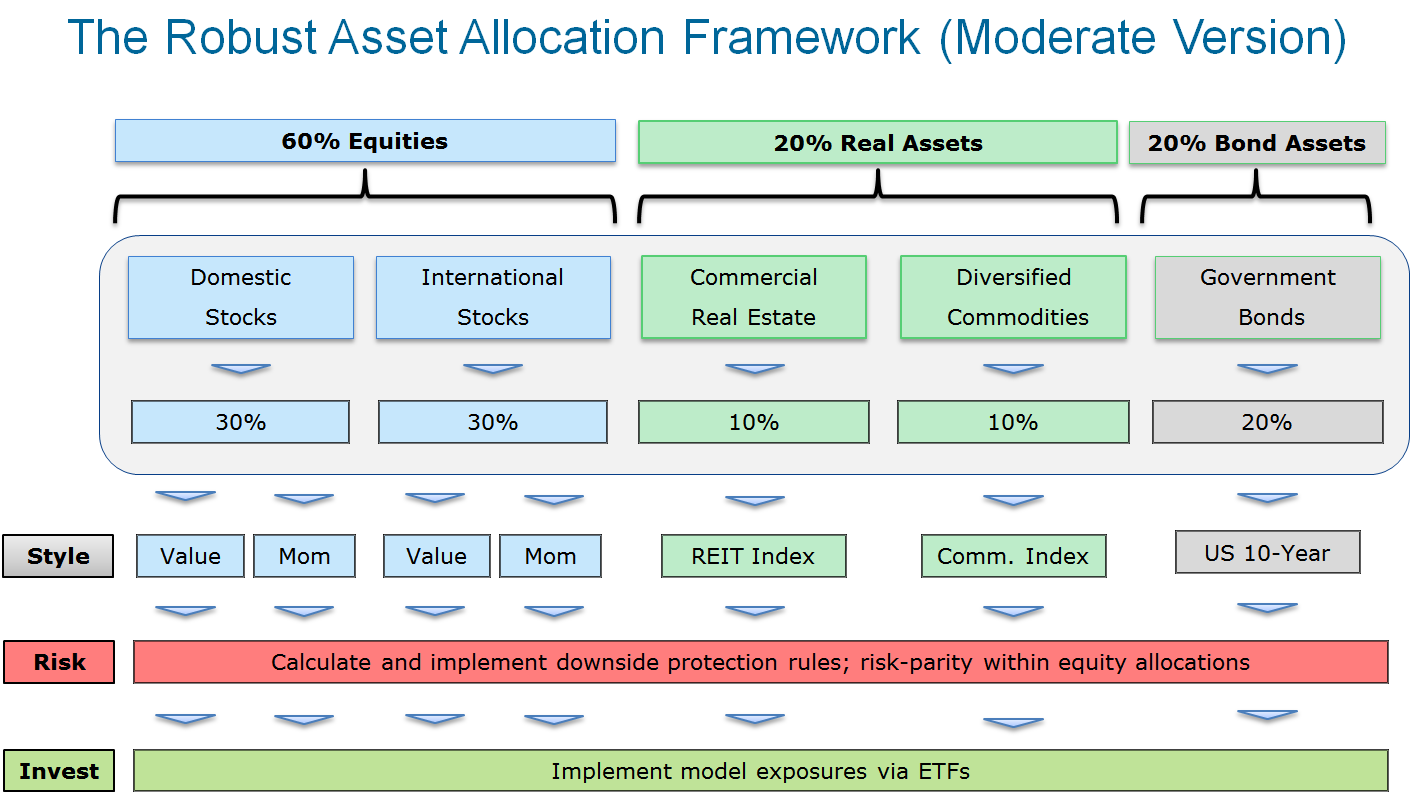
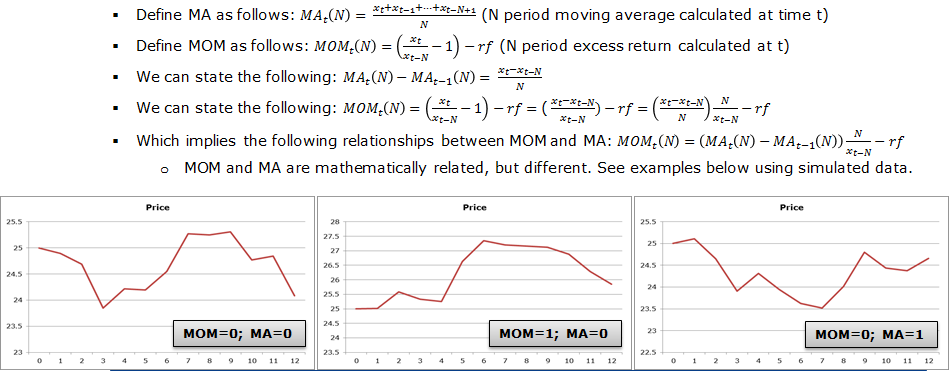
DeMiguel et al. are not the only researchers suggesting that simplicity often rules the day when it comes to asset allocation. Even the great Harry Markowitz, a Nobel Prize winner and the founder of portfolio management, is quoted as saying: “I should have computed the historical covariance of the asset classes and drawn an efficient frontier, [but] I split my contributions 50/50 between bonds and equities.” A few quotes attributed to Einstein sum up the key lessons learned from piles of disinterested research compiled on the subject of asset allocation. “Don’t try anything fancy. Stick to a simple diversified portfolio, keep your costs down and rebalance periodically to keep your asset allocations in line with your long-term goals.” –David Swensen, Yale Endowment CIO. The point of the DeMiguel et al. research cited above is not to imply that equal-weight allocations are always optimal and/or sensible. For example, if a portfolio consists of two assets — 1) call options on 3x leveraged S&P 500 ETFs and 2) 90-day T-bills — an equal-weight allocation may not make sense because the assets involved have dramatically different risk profiles and the 50% allocation to the call options on 3x levered S&P will obviously dominate all the action in the portfolio. So perhaps 50/50 isn’t the answer, but neither is dynamic risk-parity with machine-learning Q-theory Black-Litterman Whiz-bang mousetrap optimization across these 2 assets. Maybe a static 20/80 allocation will fit the bill? The main point of their research is that the signals generated by whiz-bang asset allocation models typically reflect noise, not actual signal. And that brings us to the so-called benchmark for asset allocation, which is often considered the 60/40 portfolio, which is 60% allocated to global equities and 40% allocated to global bonds.(5) This portfolio reflects the essence of the advice gleaned from DeMiguel et al.’s work — keep it simple. That said, “experts” will put forth hundreds of arguments for why the 60/40 portfolio is sub-optimal, won’t work, and so forth, but the reality is that the portfolio does follow the FACTS framework and does provide some reasonable diversification. We can all argue why 60/40 is broken (I’m happy to provide those arguments), but for many investors this is an option worth considering. So how can we possibly improve upon the baseline 60/40 benchmark without going down the complexity railroad, which often is a bridge to nowhere? One approach is to look at the 60/40 portfolio as essentially 60% equity and 40% “diversifiers.” Bonds are often dumped in the diversifier bucket because they are relatively easy to understand. But bonds only represent one form of a diversifier — there are many others — but will bonds always be an effective diversifier? We’re not sure. Should we really put all our eggs in the bond diversification bucket? Possibly, but it seems prudent to at least consider a more robustly designed diversifier bucket. We need to be careful when we explore a more complex diversifier allocation — the cure may be worse than the disease. When it comes to diversifiers, often labeled “alternatives,” one can go nuts trying to compile unique risk/return premiums. Perhaps this effort is appropriate for some investors with the time, resources, and buying power to create a solution that is in line with the FACTS and achieves their specific objectives. However, for the rest of us (and maybe even the pros), we may be better off trying to replicate what larger more sophisticated investors can achieve, but without all the brain damage and costs. The “IVY 5” portfolio, described by Faber (2007) and then further elaborated by Faber and Richardson (2009), is a great example of this approach. The authors highlight that the largest endowments have highly complex portfolios that extend well beyond the 60/40 benchmark with respect to their levels of complexity. Nonetheless, the performance of a simple endowment replication model, consisting of five core asset classes, does a pretty reasonable job at capturing their performance. The five core asset classes are as follows: With a shift away from equal-weights across the five assets, we can augment the IVY 5 concept to create a 60/40 portfolio, where the key difference is the “diversifier” bucket is no longer entirely dependent on bonds, but has a mix of real assets and bonds. We refer to this portfolio as “RAA Simple.” The goal of RAA Simple is to capture expected returns associated with a diversified pool of global assets. Arguably, this slightly more complex 60/40 allocation is structurally more robust to various economic regimes in the future and doesn’t have all the diversifier eggs in the “bond basket.” RAA Simple achieves its goal of capturing global risk premiums without the chaos of any individual asset class. Another thing to point out is that RAA Simple doesn’t curb your drawdown that much via diversification. But US 60/40 is also not the sure-fire answer, as the table in our “world’s longest trend following backtest highlights.” We’ll talk about potential methods to solve the limits of diversification when discussing risk management, but first, let’s move on to security selection. RAA Simple deploys passive equity investments in the form of the large-cap domestic equity and large-cap developed equity. This is a fine approach and is easy to understand and implement. However, when it comes to security selection methods, there are arguably ways to potentially improve the overall profile of the investment portfolio, without getting too far out on the complexity curve. In this section we focus entirely on the equity component of the portfolio, however, as discussed in our DIY book and throughout blog, there is research to suggests that one can leverage selection algorithms to differentiate REIT, commodity, and bond exposures. We think the juice generated from the additional complexity may not be worth the squeeze in most cases, but this is certainly something an investor could explore. In case you haven’t noticed, we have droned on and on over the potential benefits and sustainability of focused value and momentum equity exposures. We’ve even spent the time to write entire books dedicated to both of these subjects, which we encourage you to read. However, the synopsis is simple and will save you a lot of time: The key thing to consider with any simulated index is that they look good on paper — there was never a backtest published that didn’t look great. But what generated these excess returns? And why can we hypothesize that these excess returns will be captured in the future? This is a debate that still rages on in academic research circles, but essentially excess expected returns are driven by 2 potential sources: 1) additional risk, and/or 2) systematic mispricing. With value and momentum in particular, there is arguably some mispricing built into the premiums, but exploiting these premiums is not a free lunch. An investor will likely be asked to take on more risk, and one can expect to endure epic episodes of relative performance pain (See here on momentum and here on value). Bottom line: no pain, no gain is a good motto to live by when it comes to setting financial investment expectations for focused factor investments such as our flavor of systematic value and momentum. So let’s assume that the evidence is compelling enough for our quantitative value and quantitative momentum processes and you are a long-term buyer. Great. Let’s integrate these into the RAA framework. As we saw above, diversification is a prudent thing to implement in a portfolio. However, if the goal of your investment program is to capture global risk premiums and minimize permanent loss of capital, diversification isn’t going to cut it when correlations go to 1. Even the RAA Simple portfolio, which diversifies across a broad swath of assets, ate a 40%+ drawdown in 2008. Yikes. If diversification isn’t going to help some investors achieve their goal of minimizing extreme tail risks, what can an investor do? Unfortunately, we enter a murky world of complexity, which should automatically raise our spidey sense. In fact, any effort to minimize tail risk almost necessarily requires that the portfolio be 1) diversified and 2) be dynamic. A 60/40 portfolio or a RAA Simple portfolio are both diversified, but their allocations aren’t dynamic. Having reviewed and considered an incredible number of dynamic timing systems, the sad truth is it difficult to identify robustness. However, there are one class of models that are fairly simple and have historically achieved the goal of capturing risk premiums, while simultaneously minimizing the risk or large drawdowns. These models generally fall under the category of “trend-following,” and include things like moving averages and channel breakouts. The application of simple moving average rules has been demonstrated to protect investors from large market drawdowns, which is defined as the peak-to-trough decline experienced by an investor. For example, Jeremy Siegel, in his book, Stocks for the Long Run, explores the effect on performance on the Dow Jones Industrial Average from 1886 to 2006, when applying a 200-day moving average rule. Applying the rule is straightforward. If the market is above the 200-day moving average rule, hold, otherwise, go to cash. Siegel found that this simple technical rule outperforms a buy-and-hold approach, both in absolute terms and on a risk-adjusted basis. Meb also highlights similar results in his paper on the subject of long-term moving averages. We’ve conducted a similar analysis on the US stock market from 1801 to 2015 and found that trend-following rules applied on the generic stock market have been effective at minimizing tail risk events. We’ve extended the analysis to every asset class where we could get our hands on the numbers and investigated the results. Same conclusion: trend-following minimizes tail risk. Got it. This so-called trend-following aspect helps minimize large drawdowns, but 1) why should I care? and 2) can you explain the voodoo behind it? For some investors with multi-decade horizons, managing large drawdown risks, especially if it comes at an expense to long-term compounding, may not be a great idea. However, for some investors, who have shorter horizons and/or more immediate liquidity needs, risk-management is really important if they want to achieve their investment goals. The chart below highlights why large drawdowns are hazardous to your wealth. The chart on the left shows what happens to an investment portfolio when it is cut in half. Just to get back to even requires 11 years at a 7% return. Perhaps some people don’t need to tap that capital for 11 years so compounding out of the drawdown isn’t a big deal. But what if the plan was to live off your nest egg? Taking a 4% yield on $100 is one thing — taking a 4% yield on $50 is entirely different and may no longer meet the investor’s needs. The chart on the right shows what happens when there is a less severe drawdown of 15%. This is obviously not the ideal outcome, but if an investor seeks capital appreciation, they must take on risk, which means drawdowns and volatility are inevitable. But a 15% drawdown is much more manageable and only requires 3 years at 7% compounding to get back to even. A lot of investors can wait out 3 years of pain, but few can deal with 11 years of pain. The depth of research on trend-following is mind-blowing. You can quickly go down the dark rabbit hole of backtesting and generate charts that would make Bernie Madoff blush. Of course, these systems are clearly over-optimized and unlikely to be robust out of sample. Moreover, having reviewed and thought about hundreds of trend-following systems, there is one clear message — nothing works all the time. The goal is to find the simplest and most robust approaches out there and then have the conviction to follow these systems to the grave. The figure below outlines our approach: We have a time series, or absolute momentum rule, and we have a long-term moving average rule. We define each of the rules below: 1. Time Series Momentum Rule (TMOM) This rule is meant to avoid assets with poor absolute performance. 2. Simple Moving Average Rule (MA) This rule is meant to avoid assets with poor trending performance. As the equations highlight, MOM and MA rules are tied together: Time-series momentum rules (MOM) are a function of MA rules. And while MOM and MA triggers are highly correlated, there are circumstances where the rules have a difference of opinion. TMOM and MA rules are actually mathematically related. However, while these rules are similar, we’ve found evidence that these rules sometimes have a “difference of opinion,” where one rule says “risk” and the other says “no risk.” We also find that spreading our trend-following bet across these two systems is more robust than simply relying on one or the other. Step 1 outlined the idea that we don’t need overly complex asset allocation frameworks to capture global risk premiums. Step 2 suggested that we can maximize our chance of the highest expected equity risk premium via focused value and momentum exposures. In step 3 we apply trend following to each component of the RAA system — equity trend, commodity trend, bond trend, and real estate trend. RAA is our best effort to develop a simple model. Developing a complicated model would have been easier, but simple was a considerably more difficult challenge. We’ve discussed the three building blocks of the RAA Index methodology: simple asset allocation, evidence-based security selection, and a trend-following based downside protection mechanism. Here is a detailed visualization of the RAA Index process (moderate shown). We start with a more robust 60/40 framework that splits the traditional bond-only 40% diversifier bucket across real and bond assets. Next, we replace passive stock exposures with focused value and momentum exposures. Then, we calculate trend-following rules for each asset class to determine their respective exposures. Finally, we implement the model. Is the Robust Asset Allocation Index process a holy grail? Is the RAA Index appropriate for all investors? Highly unlikely. Here are some reasons why the RAA concept is a bad idea: Value/momentum can drag on returns relative to passive equity portfolios Long story short, RAA will not always work and will often underperform standard benchmarks. But that is baked in the cake. The systems are simply our best attempt to achieve the goal of capturing global risk premiums, while simultaneously minimizing the chance of a permanent loss of capital. Simple as that. We want to emphasize that RAA is merely one proposed solution to achieve a specific investment goal. There are a set of other solutions in the marketplace that seek to do similar thing and we recommend that investors explore all of these options. However, we suggest that investors can narrow their solutions down to those options that are simple, liquid, transparent, affordable, and tax-efficient (if applicable). Sounds great — What’s the next step? Investors have a few options with the Robust Asset Allocation Indexes: As always, feel free to contact us if you have any questions or thoughts. References[+] If this is too much brain damage, simply head over to our active robo advisor and we’ll implement a strategy that attempts to follow the RAA Index most suitable for your investment profile. The chart above is visualized below. Sharpe ratio is on the X-axis for the various asset allocation systems trading with S&P sectors. Note that the simple 1/N strategy works as well, and often better, than more complex approaches. Conclusion: Asset allocation models are 99% noise; 1% signal. Here is a sampling of the various ideas we have tested: Macroeconomic Fundamental Indicators Technical Indicators Sentiment and Variance Indicators Comprehensive Summary of Different Predictors The sad conclusion is that none of these ideas stand up to intense robustness tests, except for the simplest, technical rules. You just can’t beat them.

Complexity is Suspect. Is Equal-Weight the Answer?
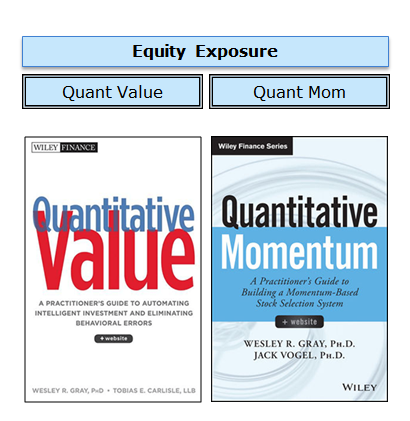
#2 Security Selection: Instead of story-based stock selection, use evidence-based stock selection
#3 Risk Management: instead of no downside protection, use downside protection.

Why Tail-Risk Management Matters

Roger That — I Get Why I Want to Control My Drawdowns. Can You Explain the Voodoo Magic of Trend-Following?

Robust Asset Allocation — Putting It All Together
The Robust Asset Allocation Index – is it the Holy Grail?
Getting start with the Robust Asset Allocation Indexes
↑1 Of course, as the authors of the book, DIY Financial Advisor, we’d be remiss if we failed to mention that another option for investors is to simply Do-It-Yourself. This is a fine option if one has the 1) time, 2) sophistication, and 3) discipline to identify an investment goal, build a portfolio to achieve that goal, and can stick to the program through thick and thin.
↑2 I have a Google Talk on the book if you want a video version of the DIY philosophy.
↑3 Past performance is no guarantee of future results. Any historical returns, expected returns, or probability projections may not reflect actual future performance. All securities involve risk and may result in loss. Our downside protection models may not work in all situations and could fail to achieve their objectives.
↑4 The results below, taken from the DeMiguel et al. paper on asset allocation, highlight the incredible robustness associated with an equal-weight, or 1/N, type of asset allocation regime. (we have our own version of this in “Tactical Asset Allocation: Beware of Geeks Bearing Formulas“)
 https://alphaarchitect.com/wp-content/uploads/2014/12/complexity.png 1405w" sizes="(max-width: 1030px) 100vw, 1030px" />
↑5 Why this portfolio structure became the benchmark solution is beyond me and perhaps there is someone who has done the history of how this came to be.
↑6 The most compelling argument is with respect to the commodity exposure, which we benchmark using the GSCI index, however, there are economic and evidence-based reasons why in practical implementation GSCI may not be the desired vehicle.
↑7 We have examined hundreds of risk-management platforms over the years. You name it–we’ve backtested it, thought about it, and/or considered implementing it. We’ll keep testing new ideas and trying to identify the holy grail, but we haven’t found it yet.
↑8 We have actually identified the mathematical relationship between MOM and MA Rules, outlined in the chart below:
↑9 Here is an extensive study on these rules and their historical performance on a slew of generic return data series.
About the Author: Wesley Gray, PhD
—
Important Disclosures
For informational and educational purposes only and should not be construed as specific investment, accounting, legal, or tax advice. Certain information is deemed to be reliable, but its accuracy and completeness cannot be guaranteed. Third party information may become outdated or otherwise superseded without notice. Neither the Securities and Exchange Commission (SEC) nor any other federal or state agency has approved, determined the accuracy, or confirmed the adequacy of this article.
The views and opinions expressed herein are those of the author and do not necessarily reflect the views of Alpha Architect, its affiliates or its employees. Our full disclosures are available here. Definitions of common statistics used in our analysis are available here (towards the bottom).
Join thousands of other readers and subscribe to our blog.