Eric Crittenden was recently on Meb Faber’s podcast and he tells a compelling story about the perils of survivor bias in backtesting. Eric’s story begins when he is an undergraduate working on a project for a quantitative finance course. The professor asked that the students develop a systematic investment program and get their hands dirty with backtesting. Eric decided to backtest a portfolio that went long 52-week low stocks and went short 52-week high stocks. Eric’s backtest worked wonderfully on paper and he was sure he’d become a billionaire pretty quickly. Eventually, Eric decided to run the portfolio in live trading. But an odd thing happened — all the system did was lose money, even though the backtested results continued to be strong.
But why was Eric’s backtest showing strong results, while the live results did the opposite?
Turns out the puzzle was solved after Eric realized that his dataset did not incorporate information on delistings — the only data included in the dataset he was using was the information associated with those firms that survived. Unfortunately, a survivor-biased database creates a major problem for systems based on price movements. For example, 52-week low stocks are often stocks with major problems and they have a high chance of entering financial distress (i.e., a high chance of delisting). Excluding 52-week low delisters from the sample will seriously bias the results in favor of strong results because 52-week low stocks–that survive into the future–are typically big winners in the future.
Remarkably, if one formally deal with delistings using relatively survivor-bias-free databases, researchers actually find that strategies that go long 52-week high stocks and short 52-week low stocks are the more profitable way to leverage the 52-week signal (the inverse of the strategy Eric originally backtested.)
Bottomline: Understand your data when doing financial research.
So how does one deal with delistings and the associated survivor bias problem?
Two things to get you started in the right direction:
- Step 1: Find a good database with delisting data and use the appropriate code
- Step 2: Read Chapter 10 of our book Quantitative Value.
Digging a bit deeper into Step 2, we summarized some elements we discuss in QV’s Chapter 10.
We first describe survivor bias:
One well-known error is caused by survivor bias, so called because it stems from the inclusion of “survivors”—those stocks that are not delisted—to the exclusion of those that are delisted, which causes the study to be biased in favor of the survivors.
Next, we outline a solution from one of my academic co-authors, friend, and
…We need to incorporate the delisted security data into our returns. In their paper, “Delisting Returns and their Effect on Accounting-Based Market Anomalies,” Richard Price, William Beaver, and Maureen McNichols identified an algorithm that sensibly merges the CRSP delisting information into a final returns database.
Here is the chart from the Price et al. paper that highlights how delisting information affects backtested returns (using book-to-market sorts as an example):
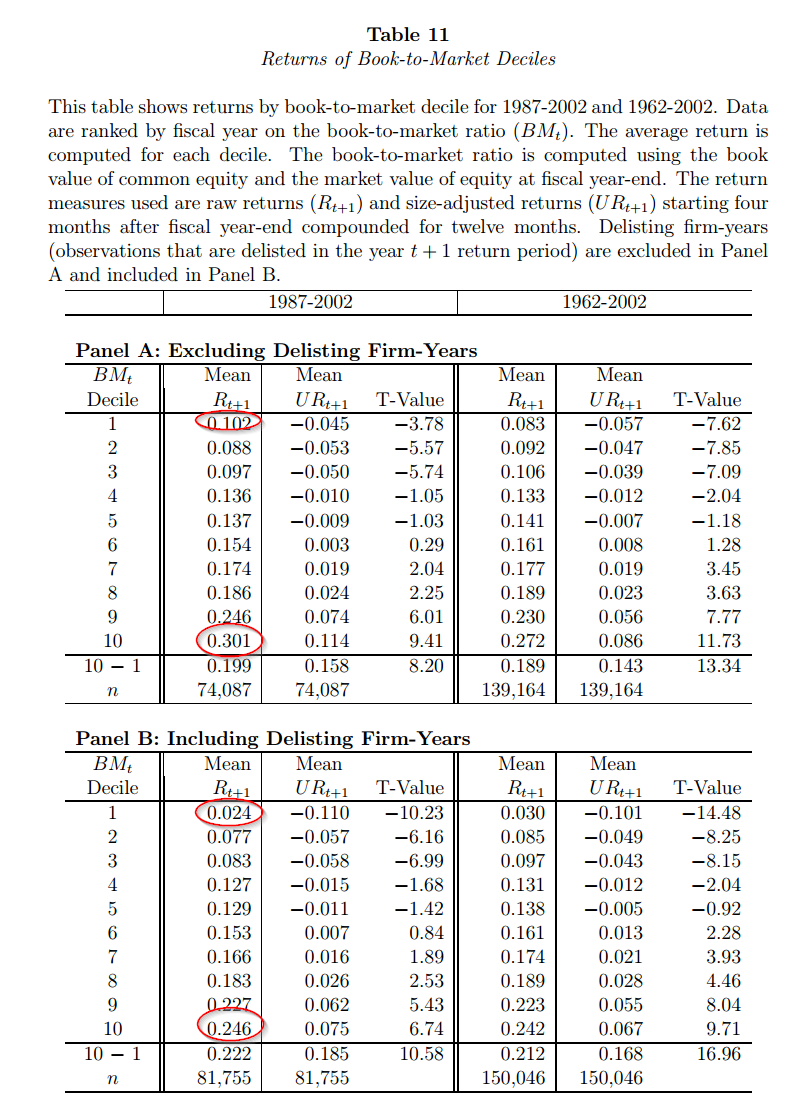
Click to enlarge. The results are hypothetical results and are NOT an indicator of future results and do NOT represent returns that any investor actually attained. Indexes are unmanaged, do not reflect management or trading fees, and one cannot invest directly in an index. Additional information regarding the construction of these results is available upon request.
The mean annual return for deep value is 30.1% when one does not consider delisting information, but goes down to 24.6% when delisting info is included. The most expensive firms earn 10.2% prior to delisting info, and 2.4% after incorporating the appropriate data.
Wow. There is a dramatic difference in results associated with simple B/M sorts depending on how one incorporates delisting information.
How can we be sure our backtest is valid?
Conducting quantitative research often sounds easy — click the button on the canned software and get the answer. The reality is much different. The devil is always in the details and there is a reason why people spend 4-6 years in PhD programs to learn the research craft. Moreover, great backtests don’t mean much because “easy money” evaporates quickly. One must always couple backtested results (even great ones with clean data) with the lessons learned from our sustainable active framework.
All those caveats aside, conducting backtests and building your own programs is always good idea if you are serious about doing academic research. For example, when we built our Quantitative Value and Quantitative Momentum programs we programmed every line of code and were constantly buried in the raw data files. Does doing your own analysis and building your own software mean the results are flawless and free of errors? Of course not, but at least the researcher understands the assumptions behind the results.
Here are some tools and sites to get you started:
- Here is the information on the delisting data items available in CRSP, which is the return dataset used by almost all academic researchers.
- Here is a link to Richard Price’s website and his program site which has code to incorporate delisting data.
Good luck.

About the Author: Wesley Gray, PhD
—
Important Disclosures
For informational and educational purposes only and should not be construed as specific investment, accounting, legal, or tax advice. Certain information is deemed to be reliable, but its accuracy and completeness cannot be guaranteed. Third party information may become outdated or otherwise superseded without notice. Neither the Securities and Exchange Commission (SEC) nor any other federal or state agency has approved, determined the accuracy, or confirmed the adequacy of this article.
The views and opinions expressed herein are those of the author and do not necessarily reflect the views of Alpha Architect, its affiliates or its employees. Our full disclosures are available here. Definitions of common statistics used in our analysis are available here (towards the bottom).
Join thousands of other readers and subscribe to our blog.