Stock market anomalies behave in mysterious ways. Over long periods of time they can provide expected outperformance versus passive indexes, but in the short run they can experience bouts of gut-wrenching underperformance (e.g., value and momentum).
What accounts for this sporadic performance and these tantrum-like swings? As with other difficult questions, academic research has provided some insights. Recent research suggests that investor “performance chasing” may play a role. We have discussed aspects of performance chasing here and here, and how it gives rise to the “investor return gap,” (discussed here) whereby investors shoot themselves in the foot by trying to effectively “time” in and out of strategies.
A new line of research extends this analysis in some intriguing ways.
Do Smart Money and Dumb Money Flows Drive the Anomalies?
In “Smart Money, Dumb Money, and Capital Market Anomalies,” by Akbas, Armstrong, Sorescu and Subrahmanyam, the authors test a couple of hypotheses:
- Does “dumb money,” which is performance chasing, drive prices away from fundamental value, and
- Does “smart money,” drive prices back towards fundamental value?
The authors investigate fund flows for mutual funds, which is assumed to be dumb money, and hedge funds, which is assumed to be smart money, and how these fund flows relate to the ebb and flow of stock market mispricing.
They test their hypothesis by setting up an experiment.
- First, they establish a proxy for mispricing, in order to measure whether mispricing generally is high, or low.
- Next, they measure overall fund flows to mutual funds and hedge funds.
- Finally, they examine the relationship between observed stock market mispricing and these fund flows.
How do they Measuring Mispricing?
In order to construct a proxy for cross-sectional mispricing, the authors use a method established by Stambaugh, Yu and Yuan, which is based on 11 variables that predict stock market returns after controlling for so-called risk factors (e.g., 3-factor Fama French model):
- Return on Assets, O-Score, Failure Probability, Gross Profitability, Net Stock Issues, Accruals, Composite Equity Issues, Investment-to-Assets, Net Operating Assets, Asset Growth, and Momentum.
This composite of the anomalies serves as a proxy for aggregate mispricing. When aggregate mispricing is being corrected, a hedged strategy (long undervalued stocks and short overvalued stocks) should produce positive returns, as prices move towards fundamentals. By contrast, when stock prices further move away from fundamental value, cross-sectional mispricing becomes more acute and a hedged strategy produces negative returns.
The sample includes stocks listed on the NYSE, AMEX and Nasdaq (excluding stocks < $5/sh), and covers the period January 1994 through December 2012.
How Do They Measure Fund Flows
Mutual fund flows are measured using data from the CRSP Survivor-Bias-Free US Mutual Fund database. The sample includes > 1.5 million fund-month observations. Hedge fund flows are measured using data from the Lipper TASS database. The sample includes > 250K fund-month observations.
What Does the Evidence Say?
Panel A (below) shows the relation between aggregate mutual fund (dumb money) flows and returns to the individual anomalies. In general, there is a negative relationship between anomaly return and “dumb money” flows. So an increase in mutual fund flows leads to contemporaneously lower anomaly returns.
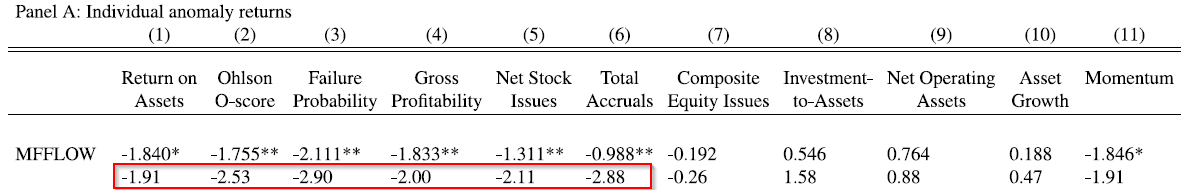
The results are hypothetical results and are NOT an indicator of future results and do NOT represent returns that any investor actually attained. Indexes are unmanaged, do not reflect management or trading fees, and one cannot invest directly in an index. Additional information regarding the construction of these results is available upon request.
Note that anomalies one through six (and 11) are significant and share an intriguing common characteristic: they all relate to growth investing!
- Low ROA: high assets relative to earnings is a growth investing concept
- High O-Score: higher leverage and higher market-to-book multiples represent growth investing
- High Failure Probability: again, higher leverage and market-to-book multiples represent growth investing
- Lower Gross Profitability: lower profit margins are likely to be associated with growth stocks
- High Net Stock Issues: firms with low cash flows rely on equity offers to raise capital, and tend to be growth stocks
- High Accruals: stocks with earnings inflated by accruals are likely to be growth stocks
Growth stocks are characterized by high recent earnings growth, and growth investors extrapolate this past performance, and expect it to continue in the future (an idea explored by Lakonishok Shleifer and Vishny, as we discuss here). Sadly for growth investors, this is often not a good statistical bet, since they tend to overpay for future growth that is not realized, as we discuss here.
The momentum results are a bit odd, as one would intuitively expect that mutual fund flows would be positive for momentum strategies. Perhaps there is a disposition effect in play (see Frazzini’s paper here)?
The authors point out that items 7 through 10 reflect “real investment” and that their fund flows do not seem to exacerbate mispricing in these anomalies.
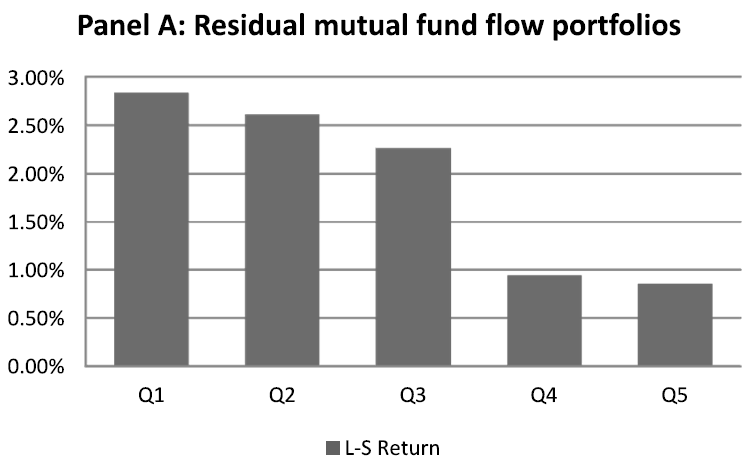
Do Mutual Fund Flows Deepen Mispricing?
The chart below highlights the long/short returns for an equal-weight basket of the anomaly portfolios, sorted by quintiles of residual mutual fund flows. Quintile 1 represents L/S returns when residual mutual fund flows are low, while quintile 5 represents L/S returns when residual mutual fund flows are high.
The results are hypothetical results and are NOT an indicator of future results and do NOT represent returns that any investor actually attained. Indexes are unmanaged, do not reflect management or trading fees, and one cannot invest directly in an index. Additional information regarding the construction of these results is available upon request.
What do you notice?
Our L/S return series is high when mutual fund flows are low, and L/S returns are low when mutual fund flows are high. Recall from “How to measuring mispricing?” above that when mutual fund flows are higher, the L/S strategies produces negative returns. What are the levels of residual mutual fund flows when our L/S does poorly? They are high. Moreover, the authors examine the long and short components separately, and determine that mutual fund flows are significantly related to the short leg, suggesting that mutual funds accentuate mispricing of already overvalued stocks.
Mutual fund flows exacerbate cross-sectional mispricing along the growth dimension. When retail investors chase performance, allocating to growth funds that have done well, overvalued stocks held in those funds at the beginning of the month become more overvalued by the end of the month. When new performance chasing capital is allocated to these mutual funds, the managers invest these new flows into the stocks they already own. The prices of these stocks then experience a reversal over the next 3 months.
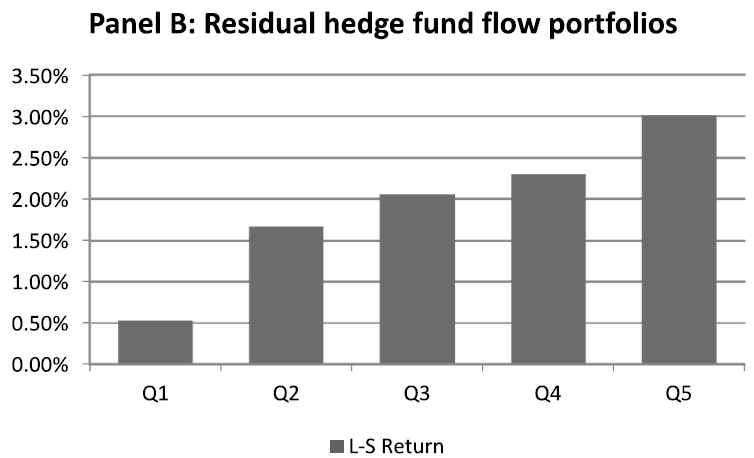
Do Hedge Fund Flows Correct Mispricing?
By contrast, the authors find that when (smart) hedge funds experience inflows, cross-sectional mispricing is reduced. Overvalued stocks held by these hedge funds at the beginning of the month become less overvalued by the end of the month. The prices of these stocks exhibit no reversal over the next 3 months.
The graph below shows the L/S results of quintile portfolios formed using residual hedge fund flows.
The results are hypothetical results and are NOT an indicator of future results and do NOT represent returns that any investor actually attained. Indexes are unmanaged, do not reflect management or trading fees, and one cannot invest directly in an index. Additional information regarding the construction of these results is available upon request.
The average L/S returns in quintile 5 are high when hedge fund flows are high, and in quintile 1 are low when hedge fund flows are low. This is exactly the opposite of what we saw with mutual fund flows!
Remarkable. The authors suggest that hedge funds can therefore be said to act as arbitrage capital that corrects mispricing.
While more work remains to be done to establish definitively that fund flows are one of the main drivers of anomaly returns, this research would seem to move us in the direction of such a conclusion.
The research also brings up questions related to anomalies in the future. We currently have a situation where hedge fund redemptions are rampant and index-like fund flows are massive. The paper’s results would suggest that anomaly returns would be poor during this transition from “smart money” to “dumb money” — which has been the case — but that the poor anomaly returns will reverse in the future. I’ll guess we’ll have to wait and see!
Smart Money, Dumb Money, and Capital Market Anomalies
- Dimson, Rousseau, and Spaenjers
- A version of the paper can be found here.
- Want a summary of academic papers with alpha? Check out our Academic Research Recap Category.
Abstract
We investigate the dual notions that “dumb money” exacerbates well-known stock return anomalies, and “smart money” attenuates these anomalies. We find that aggregate flows to mutual funds (“dumb money”) appear to exacerbate cross-sectional mispricing, particularly for growth, accrual, and momentum anomalies. In contrast, hedge fund flows (“smart money”) appear to attenuate aggregate mispricing. Our results suggest that aggregate flows to mutual funds may have real adverse allocation effects in the stock market, while aggregate flows to hedge funds contribute to the correction of cross-sectional mispricing.

About the Author: David Foulke
—
Important Disclosures
For informational and educational purposes only and should not be construed as specific investment, accounting, legal, or tax advice. Certain information is deemed to be reliable, but its accuracy and completeness cannot be guaranteed. Third party information may become outdated or otherwise superseded without notice. Neither the Securities and Exchange Commission (SEC) nor any other federal or state agency has approved, determined the accuracy, or confirmed the adequacy of this article.
The views and opinions expressed herein are those of the author and do not necessarily reflect the views of Alpha Architect, its affiliates or its employees. Our full disclosures are available here. Definitions of common statistics used in our analysis are available here (towards the bottom).
Join thousands of other readers and subscribe to our blog.