“What is the correct benchmark for trend following?”
This is a difficult question, and there really is no perfect answer.
As many of our readers know, we are fans of trend following and trend-followed portfolios. For those unfamiliar with trend following, the idea is rather simple–invest in an asset class if the price/return to that asset class is trending up. If not, go to cash or hedge your exposure. We have articles here and here describing the pros and cons of trend following.
Now a massive component of trend following entails either being (1) out of an asset class or (2) being hedged within an asset class. So the goal of this article is to highlight that trying to benchmark a trend following strategy can be difficult, especially compared to buy-and-hold (B&H) portfolios. Note that this is not necessarily a “new” idea. Nathan and Jesse have good explanations on this subject as well.(1)
But it also raises a good question–for trend-followed strategies (e.g., our Global Value Momentum Trend Index), what is the true benchmark to compare returns against? Is it a buy-and-hold equity benchmark? Or should it be something different?
First, let’s examine the historical performance of simple trend-following strategies.
Trend-Following Historical Performance
To give some context to trend following, I am displaying the returns to trend-followed portfolios on the five major asset classes:
- SP500 — SP500 total return
- EAFE — EAFE total return
- T-Bond — U.S. 10-Year Treasury Bond total return
- REITs — NARIET index total return
- Commodities — GCSI index total return
The portfolios and their returns are shown first without trend, and then with trend-following.
The returns below are from 1/1/1973-12/31/2017. All portfolios are gross of any transaction or management fees and represent total returns, which include dividends and other distributions.
| SP500 | EAFE | T-Bond | REITs | Commodities | |
| CAGR | 10.52% | 8.49% | 7.75% | 11.94% | 5.84% |
| Standard Deviation | 15.14% | 17.03% | 8.15% | 16.88% | 20.34% |
| Maximum Drawdown | -50.21% | -56.68% | -20.97% | -68.30% | -80.90% |
The results are hypothetical results and are NOT an indicator of future results and do NOT represent returns that any investor actually attained. Indexes are unmanaged, do not reflect management or trading fees, and one cannot invest directly in an index.
The returns below are from 1/1/1973-12/31/2017. All asset classes apply a 12-month moving average rule to the total return index, and either invest (1) in the index if a positive trend or (2) in cash (U.S. T-bills) is a negative trend. All portfolios are gross of any transaction or management fees.
| SP500 (trend) | EAFE (trend) | T-Bond (trend) | REITs (trend) | Commodities (trend) | |
| CAGR | 10.87% | 9.85% | 7.67% | 11.57% | 8.12% |
| Standard Deviation | 11.58% | 12.10% | 6.88% | 12.03% | 16.26% |
| Maximum Drawdown | -23.58% | -21.08% | -11.26% | -20.77% | -57.41% |
The results are hypothetical results and are NOT an indicator of future results and do NOT represent returns that any investor actually attained. Indexes are unmanaged, do not reflect management or trading fees, and one cannot invest directly in an index.
As is shown above, the overall annualized returns to trend-followed portfolios, over long-time cycles, are similar to B&H. Standard risk-adjusted metrics (e.g., Sharpe Ratio) are also similar, depending on the time period or sample period analyzed. And because expected returns and risk-adjusted metrics are similar, many academics (and practitioners) question the efficacy of trend-following. But the goal of trend-following is to manage tail risks, such as large maximum drawdowns. Unfortunately, this metric is of generally scoffed at by academics, as they prefer to focus on more statistics-friendly metrics like standard deviation.(2)
What is the Correct Benchmark for Trend-Following?
So getting back to the original question–what is the benchmark for a trend-followed portfolio?
As mentioned above, trend following is invested in the risk asset some of the time, while being in the risk-free asset at other times (when the trend is negative). So a natural question is to know what percentage of the time that trend following is actually invested in the risk asset.
Below are the percentage of the time that trend following is actually invested in the risk asset. The rest of the time, the portfolio is assumed to invest in T-bills.
The numbers are generated using the time period of 1/1/1973-12/31/2017 (these could certainly change in the future):
| SP500 | EAFE | T-Bond | REITs | Commodities | |
| % of the time in risk asset | 76.11% | 69.81% | 79.44% | 78.15% | 62.96% |
| % of the time in risk-free asset | 23.89% | 30.19% | 20.56% | 21.85% | 37.04% |
The results are hypothetical results and are NOT an indicator of future results and do NOT represent returns that any investor actually attained. Indexes are unmanaged, do not reflect management or trading fees, and one cannot invest directly in an index.
As shown above, the amount of time one is in the risk asset varies. From 1973-2017, if an investor was utilizing trend following on U.S. stocks (SP500), they would have been invested in U.S. stocks 76.11% of the time while in T-bills 23.89% of the time.
So what if we simply compare the trend-followed strategy to a weighted portfolio?
This would be comparing the SP500 trend-followed portfolio to a portfolio composed of 76.11%*Sp500 + 23.89%*T-Bills, at all times. The same will be done for each asset class using the percentages calculated above.
Below we examine the returns of the portfolios, starting first with the U.S. stock portfolio (SP500):
Domestic Equity (SP500)
| SP500 (trend) | 76.11% SP500 and 23.89% RF | SP500 (B&H) | |
|---|---|---|---|
| CAGR | 10.87% | 9.35% | 10.52% |
| Standard Deviation | 11.58% | 11.52% | 15.14% |
| Maximum Drawdown | -23.58% | -40.39% | -50.21% |
The results are hypothetical results and are NOT an indicator of future results and do NOT represent returns that any investor actually attained. Indexes are unmanaged, do not reflect management or trading fees, and one cannot invest directly in an index.
As can be seen above, the portfolio mix of SP500 and T-Bills (RF) has a lower (1) return, (2) standard deviation, and (3) drawdowns than the B&H portfolio. This is to be expected, as the portfolio now is on 76.11% invested in the risk asset (SP500 in this case) and has the remaining amount (23.89%) in the risk-free asset.
However, when comparing the mixed portfolio to the trend-followed portfolio, one notices that trend following has (1) higher returns, (2) similar standard deviations, and (3) lower drawdowns. Again, over this time period, the trend-followed portfolio and the mixed portfolio have the same percentage allocation to both (1) the risk-asset and (2) the risk-free asset! The difference between the two portfolios is that the trend-followed portfolio will dynamically shift the weights between the risk and the risk-free asset–thus, at times, one is 100% in the risk asset, while at other times one is 100% in the risk-free asset.
So even though the two portfolios have the same net exposure to the risk asset, in the past, the trend-followed portfolio generated higher returns.
Below we examine the same tests on the four other risk assets:
Developed Equity (EAFE)
| EAFE (trend) | 69.81% EAFE and 30.19% RF | EAFE (B&H) | |
|---|---|---|---|
| CAGR | 9.85% | 7.68% | 8.49% |
| Standard Deviation | 12.10% | 11.89% | 17.03% |
| Maximum Drawdown | -21.08% | -43.05% | -56.68% |
The results are hypothetical results and are NOT an indicator of future results and do NOT represent returns that any investor actually attained. Indexes are unmanaged, do not reflect management or trading fees, and one cannot invest directly in an index.
Real Estate (REITs)
| REIT (trend) | 69.81% REITs and 30.19% RF | REIT (B&H) | |
|---|---|---|---|
| CAGR | 11.57% | 10.62% | 11.94% |
| Standard Deviation | 12.03% | 13.19% | 16.88% |
| Maximum Drawdown | -20.77% | -57.28% | -68.30% |
The results are hypothetical results and are NOT an indicator of future results and do NOT represent returns that any investor actually attained. Indexes are unmanaged, do not reflect management or trading fees, and one cannot invest directly in an index.
Commodities
| Commodities (trend) | 62.96% Commodities and 37.04% RF | Commodities (B&H) | |
|---|---|---|---|
| CAGR | 8.12% | 5.95% | 5.84% |
| Standard Deviation | 16.26% | 12.84% | 20.34% |
| Maximum Drawdown | -57.41% | -62.39% | -80.90% |
The results are hypothetical results and are NOT an indicator of future results and do NOT represent returns that any investor actually attained. Indexes are unmanaged, do not reflect management or trading fees, and one cannot invest directly in an index.
Bonds (T-Bonds)
| T-Bond (trend) | 79.44% T-Bond and 20.56% RF | T-Bond (B&H) | |
|---|---|---|---|
| CAGR | 7.67% | 7.18% | 7.75% |
| Standard Deviation | 6.88% | 6.50% | 8.15% |
| Maximum Drawdown | -11.26% | -15.33% | -20.97% |
The results are hypothetical results and are NOT an indicator of future results and do NOT represent returns that any investor actually attained. Indexes are unmanaged, do not reflect management or trading fees, and one cannot invest directly in an index.
As can be seen above, in the past, trend following generally had (1) higher returns and (2) lower drawdowns than the risk/risk-free weighted portfolio, which is invested in the risk/risk-free in the same proportion as the trend-followed strategy. The only difference is that the weighted portfolio has a permanent risk-free asset exposure, while the trend-followed portfolio varies its exposure.
Another possible way to examine how well trend following worked, relative to a weighted portfolio, would be to randomly (according to the respective weights) invest in the (1) risk asset or the (2) risk-free asset each month and run 1,000 simulations. What this does is each month, assigns a probability of being in the risk asset equal to the weights in the past, such as 76.11% for the SP500, and 69.81% for EAFE. Not surprisingly, the results (shown in the reference link at the end of the sentence) are similar to the weighted portfolios.(3)
What if We Account for Potential “Look-Ahead” Bias?
So far, we have examined trend-followed portfolios against (1) B&H and (2) weighted portfolios. One issue with the weighted portfolio is that it uses weights over the entire sample to determine the percentage of the time invested in the risk asset and the risk-free asset. An alternative way to compute the weights would be to have no “look-ahead” bias and simply allocate to the risk asset and risk-free asset given by the rolling weights.
Below is a graphical description of the weights given to the SP500 and the RF over time, using the rolling method.
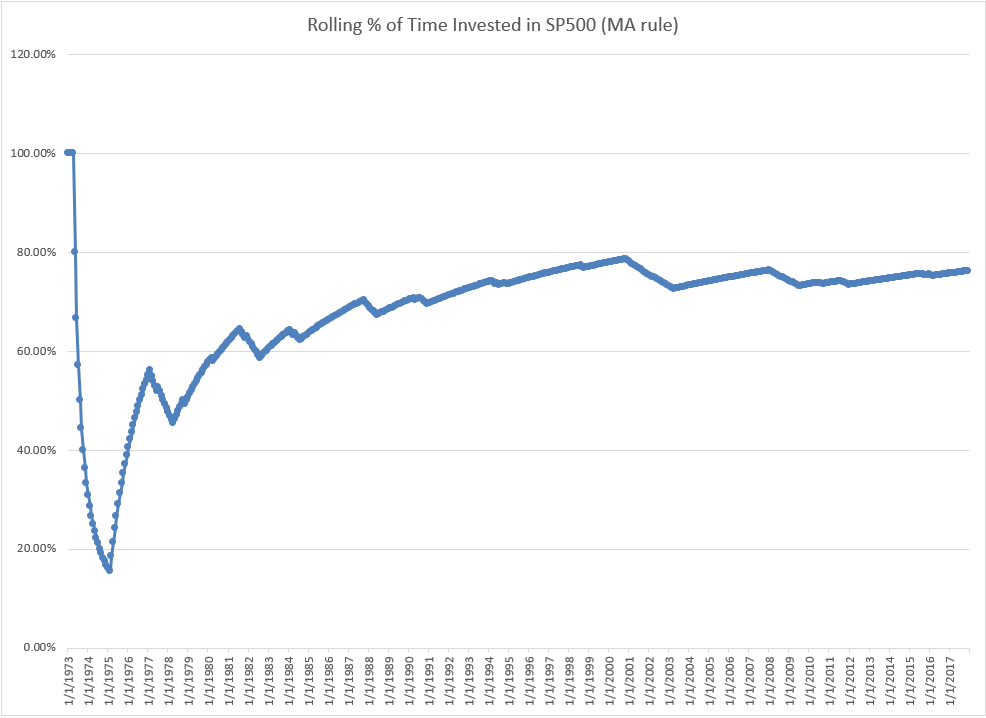
As can be seen above, the weights start at 100%, since the rule was to invest in the risk asset (SP500) in the first month. As trend-signals “trigger”, the percentage of the time invested in the risk-asset changes dynamically over time. At the end of the sample, we see that the percentage of the time invested in the risk-asset (SP500) was 76.11%, the number we used in the weighted portfolios above. So an alternative way to create the weighted portfolios would be to use the weights above and generate the rolling weights for the other asset classes–this method ensures no look-ahead bias.
The results are given below to the “rolling” weights for the 5 asset classes, using the respective weights for each risk asset.
Domestic Equity (SP500)
| SP500 (trend) | 76.11% SP500 and 23.89% RF | x% SP500 and y% RF (Rolling) | SP500 (B&H) | |
| CAGR | 10.87% | 9.35% | 9.08% | 10.52% |
| Standard Deviation | 11.58% | 11.52% | 10.13% | 15.14% |
| Maximum Drawdown | -23.58% | -40.39% | -39.82% | -50.21% |
The results are hypothetical results and are NOT an indicator of future results and do NOT represent returns that any investor actually attained. Indexes are unmanaged, do not reflect management or trading fees, and one cannot invest directly in an index.
Developed Equity (EAFE)
| EAFE (trend) | 69.81% EAFE and 30.19% RF | x% EAFE and y% RF (Rolling) | EAFE (B&H) | |
| CAGR | 9.85% | 7.68% | 7.60% | 8.49% |
| Standard Deviation | 12.10% | 11.89% | 12.07% | 17.03% |
| Maximum Drawdown | -21.08% | -43.05% | -43.95% | -56.68% |
The results are hypothetical results and are NOT an indicator of future results and do NOT represent returns that any investor actually attained. Indexes are unmanaged, do not reflect management or trading fees, and one cannot invest directly in an index.
Real Estate (REITs)
| REIT (trend) | 69.81% REITs and 30.19% RF | x% REITs and y% RF (Rolling) | REITs (B&H) | |
| CAGR | 11.57% | 10.62% | 10.39% | 11.94% |
| Standard Deviation | 12.03% | 13.19% | 12.44% | 16.88% |
| Maximum Drawdown | -20.77% | -57.28% | -57.17% | -68.30% |
The results are hypothetical results and are NOT an indicator of future results and do NOT represent returns that any investor actually attained. Indexes are unmanaged, do not reflect management or trading fees, and one cannot invest directly in an index.
Commodities
| Commodities (trend) | 62.96% Commodities and 37.04% RF | x% Commodities and y% RF (Rolling) | Commodities (B&H) | |
| CAGR | 8.12% | 5.95% | 6.13% | 5.84% |
| Standard Deviation | 16.26% | 12.84% | 14.97% | 20.34% |
| Maximum Drawdown | -57.41% | -62.39% | -64.98% | -80.90% |
The results are hypothetical results and are NOT an indicator of future results and do NOT represent returns that any investor actually attained. Indexes are unmanaged, do not reflect management or trading fees, and one cannot invest directly in an index.
Bonds (T-Bonds)
| T-Bond (trend) | 79.44% T-Bond and 20.56% RF | x% T-Bond and y% RF (Rolling) | T-Bond (B&H) | |
| CAGR | 7.67% | 7.18% | 7.09% | 7.75% |
| Standard Deviation | 6.88% | 6.50% | 5.53% | 8.15% |
| Maximum Drawdown | -11.26% | -15.33% | -11.42% | -20.97% |
The results are hypothetical results and are NOT an indicator of future results and do NOT represent returns that any investor actually attained. Indexes are unmanaged, do not reflect management or trading fees, and one cannot invest directly in an index.
As the results above highlight, using the “rolling” weights to the portfolios generates similar returns to the simple look-ahead “weighted” portfolios. Thus, even when eliminating the look-ahead bias issue, we see that trend-following generally performed better than the weighted portfolios over this sample period.
Conclusions Regarding How One Should Benchmark Trend-Following Strategies
I began the article asking a rather simple question–how should one benchmark trend following?
One approach is to simply compare the returns to the B&H benchmark. While this is a good place to start one’s analysis, one needs to remember that trend-followed portfolios are, at times, invested in the risk-free asset. Thus, one should expect, ex-ante, that trend-followed portfolios will receive lower returns because they are mechanically taking on less equity risk premium!(4)
I considered a few ways to compare the trend-followed portfolio to weighted buy-and-hold portfolios, where one invests part into the risk asset and the remainder in the risk-free asset. At a high level, this makes the total amount of “risk” taken on by the portfolios comparable–and I would recommend using one of these weighted portfolios for a true comparison.
Examining the results to the five asset classes, one notices that trend-following was a decent approach in the past, as trend-following on each asset class generated (1) returns similar to the benchmark and (2) lower drawdowns relative to the benchmark. These conclusions are the same whether or not one assumes the benchmark is (1) B&H or (2) a weighted portfolio.
However, as with anything investing related, past performance may not be indicative of future results.
For those interested in learning more about trend following, we describe our process and “why” we use trend following here, and highlight that trend following is not perfect here.
References[+]
| ↑1 | For example, I am taking Jesse’s idea to create an “X/Y” portfolio as in his post. | ||||||||||||||||||||||||||||||||||||||||||||||||||||||||||||||||||||||||||||||||||||||||||||||||||||
|---|---|---|---|---|---|---|---|---|---|---|---|---|---|---|---|---|---|---|---|---|---|---|---|---|---|---|---|---|---|---|---|---|---|---|---|---|---|---|---|---|---|---|---|---|---|---|---|---|---|---|---|---|---|---|---|---|---|---|---|---|---|---|---|---|---|---|---|---|---|---|---|---|---|---|---|---|---|---|---|---|---|---|---|---|---|---|---|---|---|---|---|---|---|---|---|---|---|---|---|---|---|
| ↑2 | That maybe a biased sentence, but Wes and I wrote a paper on maximum drawdowns which was not accepted too well by some academics. | ||||||||||||||||||||||||||||||||||||||||||||||||||||||||||||||||||||||||||||||||||||||||||||||||||||
| ↑3 |
The below “Random” portfolios (Column 3) assume that the probability of investing in the risk asset every month is equal to the percentage in Column 2 (76.11% for the SP500). 1,000 simulations are run, and the average monthly portfolio return is used to calculate the summary statistics below. Domestic Equity (SP500)
The results are hypothetical results and are NOT an indicator of future results and do NOT represent returns that any investor actually attained. Indexes are unmanaged, do not reflect management or trading fees, and one cannot invest directly in an index. Developed Equity (EAFE)
The results are hypothetical results and are NOT an indicator of future results and do NOT represent returns that any investor actually attained. Indexes are unmanaged, do not reflect management or trading fees, and one cannot invest directly in an index. Real Estate (REITs)
The results are hypothetical results and are NOT an indicator of future results and do NOT represent returns that any investor actually attained. Indexes are unmanaged, do not reflect management or trading fees, and one cannot invest directly in an index. Commodities
The results are hypothetical results and are NOT an indicator of future results and do NOT represent returns that any investor actually attained. Indexes are unmanaged, do not reflect management or trading fees, and one cannot invest directly in an index. Bonds (T-Bonds)
The results are hypothetical results and are NOT an indicator of future results and do NOT represent returns that any investor actually attained. Indexes are unmanaged, do not reflect management or trading fees, and one cannot invest directly in an index. | ||||||||||||||||||||||||||||||||||||||||||||||||||||||||||||||||||||||||||||||||||||||||||||||||||||
| ↑4 | An assumption here is also that the trend-factor has no premium or positive expected returns. Here and here give some analysis of trend returns/premiums. |
About the Author: Jack Vogel, PhD
—
Important Disclosures
For informational and educational purposes only and should not be construed as specific investment, accounting, legal, or tax advice. Certain information is deemed to be reliable, but its accuracy and completeness cannot be guaranteed. Third party information may become outdated or otherwise superseded without notice. Neither the Securities and Exchange Commission (SEC) nor any other federal or state agency has approved, determined the accuracy, or confirmed the adequacy of this article.
The views and opinions expressed herein are those of the author and do not necessarily reflect the views of Alpha Architect, its affiliates or its employees. Our full disclosures are available here. Definitions of common statistics used in our analysis are available here (towards the bottom).
Join thousands of other readers and subscribe to our blog.