Aggregate Investor Confidence in the Stock Market
- Christoph Meier
- Journal of Behavioral Finance, 2018
- A version of this paper can be found here
- Want to read our summaries of academic finance papers? Check out our Academic Research Insight category
What are the Research Questions?
- What is the effect of aggregate investor confidence on trading activity and risk appetite?
What are the Academic Insights?
By using a direct measure of aggregate investor confidence, which identifies two primary drivers of confidence: 1) strength (or extremeness)* and 2) weight** (individuals are overconfident when strength is high and weight is low), the author finds the following:
- The empirical results show that aggregate investor self-confidence is related to trading activity and risk appetite. Specifically, high aggregate investor confidence is associated with high trading activity in the subsequent two months, which partially reverses for those stocks where the effect is initially strongest. A series of tests suggest that the investor confidence index introduced in this study is a better predictor of trading activity than past return, which is used as a proxy for investor overconfidence in prior studies. Additionally, confident investors tend to have increased levels of aggregate risk appetite, and increase the proportion of small stocks subsequent to periods of high investor confidence.
* strength is the impulse of recent trading performance compared to a ‘typical’ trading performance in a given point in time.
**weight is the reliability of the impulses.
Why does it matter?
This study introduces a new measure of investor confidence, distinct from prior ones. This measure captures aggregate variations of investor confidence through feedback over time, and consequently offer much potential for applications. While existing measures of confidence and sentiment capture investors’ excitement, optimism, or comfort about the environment, this measure intends to capture impulses affecting investors’ beliefs about their ability to pick stocks, or in other words: The ability to accurately process and forecast information. A possible application for this new measure would be to explain price momentum and tests of self-attribution bias (i.e. isolating positive from negative confidence impulses).
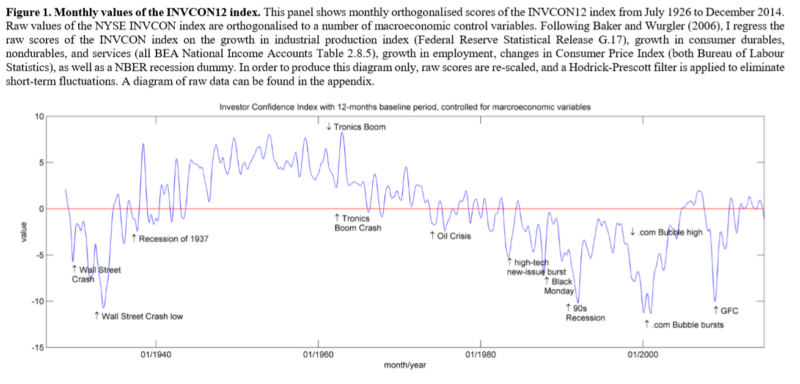
The Most Important Chart from the Paper
Figure 1 shows that investors tend to attribute market gains to their own investment talent, even if gains are shared with the entire market. The confidence measure tends to be high during periods with high market returns, and vice versa. During speculative bubbles, it scores consistently rise to relatively high levels. This applies for the months immediately before the Wall Street Crash of 1929, the Great Depression starting 1937, the ‘Tronics Boom in the early 1960s, the High Tech New Issues Bubble in the early 1980s, the black Monday in 1987, as well as the months before the burst of the Dotcom-bubble around the turn of the millennia and the Global Financial Crisis.
The results are hypothetical results and are NOT an indicator of future results and do NOT represent returns that any investor actually attained. Indexes are unmanaged, do not reflect management or trading fees, and one cannot invest directly in an index.
Abstract
This paper applies a new measure of aggregate investor confidence, which extracts feedback impulses from stock market data. According to the measure, aggregate investor confidence is positively associated with the profitability of momentum strategies. In a 1927-2014 U.S. sample, aggregate investor confidence requires around 3 months to affect market outcomes notably, and remain statistically significant for up to 16 months. Aggregate investor confidence can also partially explain the size premium, in line with conceptual accounts from prior literature. In aggregate, investors tilt their preference toward small market capitalisation and growth stocks when confidence is high. In contrast to price momentum, aggregate investor confidence affects the size premium immediately.

References[+]
| ↑1 | see “limits of arbitrage” for more insights |
|---|
About the Author: Wesley Gray, PhD
—
Important Disclosures
For informational and educational purposes only and should not be construed as specific investment, accounting, legal, or tax advice. Certain information is deemed to be reliable, but its accuracy and completeness cannot be guaranteed. Third party information may become outdated or otherwise superseded without notice. Neither the Securities and Exchange Commission (SEC) nor any other federal or state agency has approved, determined the accuracy, or confirmed the adequacy of this article.
The views and opinions expressed herein are those of the author and do not necessarily reflect the views of Alpha Architect, its affiliates or its employees. Our full disclosures are available here. Definitions of common statistics used in our analysis are available here (towards the bottom).
Join thousands of other readers and subscribe to our blog.