Open Source Cross-Sectional Asset Pricing
- Andrew Chen and Tom Zimmermann
- Working paper
- A version of this paper can be found here
What are the research questions?
There has been a wave of articles (and press) suggesting that academic research suffers from a replication crisis. A “replication crisis” simply means that other researchers are unable to replicate the results from prior research using similar experimental conditions.
Psychology seems to be the field that has received the most scrutiny, but financial economics has also received criticism. We’ve covered the subject fairly extensively, and the research we’ve discussed has been one-sided in the direction of, “most financial research is bogus”. (some example articles are here, here, here, and here.).(1)
But academic finance researchers don’t sit quietly when someone suggests that their efforts are a big waste of time. Larry recently covered an excellent piece from researchers associated with AQR which suggests that the “replication crisis” in finance really isn’t a crisis at all.
The article discussed below only reinforces the message from the AQR researchers: there isn’t a replication issue in academic finance research.
But the real contribution of this paper’s authors is to provide transparent access to the algorithms and data sources the generated the results in the first place. (similar to what AQR did).
I’ll borrow the words from the authors:
In our view, an open-source dataset is essential because recent studies cast doubt on the credibility of the entire cross-sectional asset pricing literature
What are the Academic Insights?
- There isn’t a “replication crisis” in academic finance.
But don’t take the authors’ word for it: Prove it yourself. And oh by the way, here are the resources for you to conduct your due diligence:
Why does it matter?
This paper, similar to the AQR paper, serves as a counterbalance to the argument that academic research is a bunch of trash and cannot be relied upon. But more importantly, the authors of this paper provides the resources that will allow independent researchers to transparently investigate the findings from any given research paper.
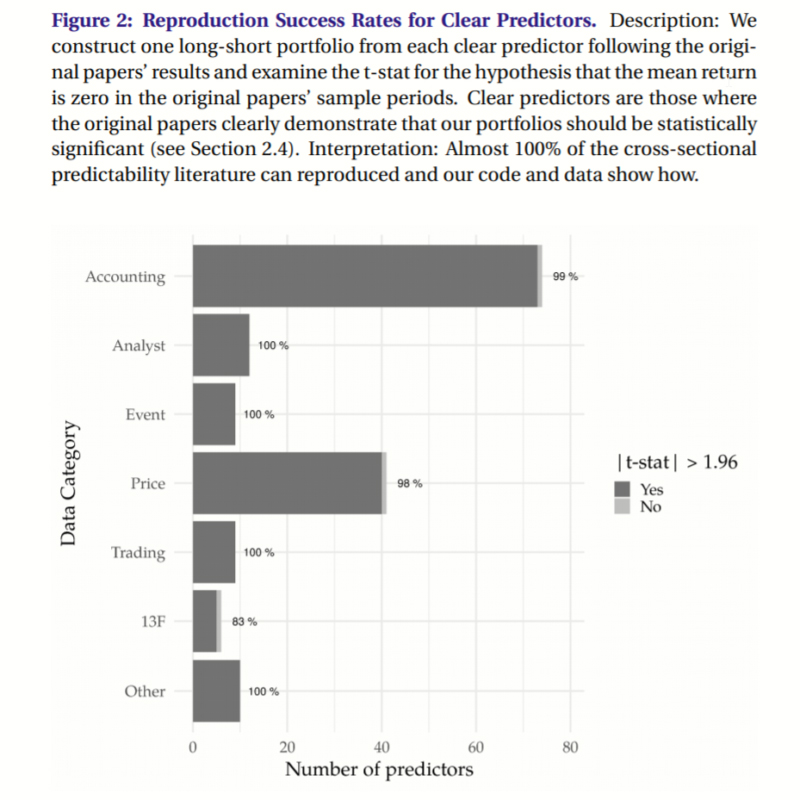
The most important chart from the paper

Abstract
We provide data and code that successfully reproduces nearly all cross-sectional stock return predictors. Our 319 characteristics draw from previous meta-studies, but we differ by comparing our t-stats to the original papers’ results. For the 161 characteristics that were clearly significant in the original papers, 98% of our long-short portfolios find t-stats above 1.96. For the 44 characteristics that had mixed evidence, our reproductions find t-stats of 2 on average. A regression of reproduced t-stats on original long-short t-stats finds a slope of 0.90 and an R^2 of 83%. Mean returns are monotonic in predictive signals at the characteristic level. The remaining 114 characteristics were insignificant in the original papers or are modifications of the originals created by Hou, Xue, and Zhang (2020). These remaining characteristics are almost always significant if the original characteristic was also significant.
About the Author: Wesley Gray, PhD
—
Important Disclosures
For informational and educational purposes only and should not be construed as specific investment, accounting, legal, or tax advice. Certain information is deemed to be reliable, but its accuracy and completeness cannot be guaranteed. Third party information may become outdated or otherwise superseded without notice. Neither the Securities and Exchange Commission (SEC) nor any other federal or state agency has approved, determined the accuracy, or confirmed the adequacy of this article.
The views and opinions expressed herein are those of the author and do not necessarily reflect the views of Alpha Architect, its affiliates or its employees. Our full disclosures are available here. Definitions of common statistics used in our analysis are available here (towards the bottom).
Join thousands of other readers and subscribe to our blog.

