Momentum, the tendency of past winner stocks to outperform past loser stocks over the next several months, is one of the most well-documented and well-researched asset pricing anomalies. In our book “Your Complete Guide to Factor-Based Investing,” Andrew Berkin and I presented the evidence of a premium that has been persistent across long periods of time, pervasive around the globe and across asset classes, robust to various formation and holding periods, and survives transactions costs. A momentum premium has been found for both cross-sectional momentum and time-series momentum (trend).
Being robust to various definitions minimizes the risk that findings are the result of data mining, and momentum has been found to be effective in using signals that are both fast and slow. A slow time-series momentum (TSMOM) strategy tends to outperform a fast TSMOM strategy when market volatility is low. The opposite tends to occur when volatility is high. This pattern of relative performance exists in most global equity markets, including both developed and emerging markets. And both TSMOM strategies can suffer from turning points in market direction—reversals in trend from uptrend to a downtrend or vice versa. Strategies based on slower signals, such as the 12-month TSMOM, take more time to turn and therefore can be more greatly affected by turning points, while strategies based on faster signals, such as one-month returns, are more reactive and suffer less from turning points. However, because of their greater responsiveness, faster signals can be the most susceptible to false turning points and as a consequence may suffer from excessive turnover and weaker performance. (see “Trend following: the epitome of no pain, no gain“).
The fact that research, including the 2017 study “Tail Risk Mitigation with Managed Volatility Strategies,” has found that past volatility largely predicts future near-term volatility—volatility is persistent (it clusters) with high (low) volatility over the recent past, tending to be followed by high (low) volatility in the near future—and that volatility is negatively correlated with returns has led to the development of strategies that scale volatility inversely to past realized volatility. Studies such as the 2017 study “A Century of Evidence on Trend-Following Investing,” the 2019 studies “Volatility Expectations and Returns” and “Portfolio Management of Commodity Trading Advisors With Volatility Targeting,” and the 2020 study “Understanding Volatility-Managed Portfolios” have found that volatility-managed portfolios (they scale position size based on the inverse of the previously realized volatility, reducing exposure when variance was recently high and vice versa) produce large alphas, increase Sharpe ratios and produce large utility gains for mean-variance investors.
Another strategy to address the problem of reversals is to use a blend of short-term, intermediate-term and long-term signals—an effective combination of signals from two or more speeds can take advantage of different market cycles and reduce exposure to the downside associated with turning points. AQR and Alpha Architect, for example, use this approach in their trend-following strategies.
Eddie Cheng, Nazar Kostyuchyk, Wai Lee, Pai Liu, and Chenfei Ma contribute to the momentum literature with their study “Trending Fast and Slow,” published in the February 2022 issue of The Journal of Portfolio Management, in which they took a different approach to address the problem of turning points. Their data sample covered the period 2000-2020. They began by noting that during this 21-year period, both fast and slow signals generated positive returns.
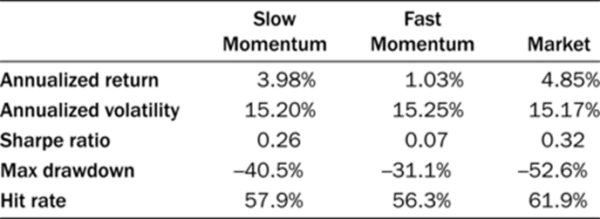
The results are hypothetical results and are NOT an indicator of future results and do NOT represent returns that any investor actually attained. Indexes are unmanaged, do not reflect management or trading fees, and one cannot invest directly in an index.
Note that the data show that strategies based on slower signals benefited from a longer-term perspective and historically have added more value than faster signals. However, they also found that fast and slow signals shared the same sign about 63.5 percent of the time—they were not always synchronized, creating a dilemma as to which signal to follow. This led the authors to explore whether a decision tree (a supervised learning technique) to determine the optimal switching mechanism between fast and slow trend signals in different volatility regimes could find a more efficient way of choosing between the fast or slow signal in order to potentially improve performance. They calculated rolling one-month S&P 500 volatility using daily returns from January 1971 and then split the sample into a 35-year training and validation period (ended in December 2005) and a 15-year test period (ended in December 2020). They then used a decision tree model with a hyperparameter of maximum depth equal to 3 and trained it only using periods when fast and slow disagreed. Following is a summary of their findings:
- Fast tends to outperform when one-month S&P 500 Index volatility is above a volatility threshold (17 percent), and slow tends to perform better otherwise.
- The volatility threshold model generated strong performance compared to either individual strategy as well as the static combination of the two.
- The volatility threshold model successfully avoided catastrophic drawdowns during the most volatile periods. Although the 50/50 mix of slow and fast also did relatively well in preventing drawdowns, it was inactive, with a neutral position 30 percent of the time.
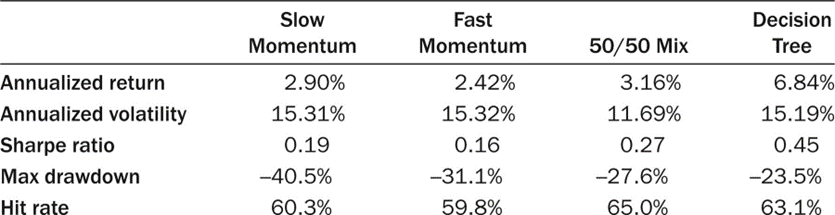
The results are hypothetical results and are NOT an indicator of future results and do NOT represent returns that any investor actually attained. Indexes are unmanaged, do not reflect management or trading fees, and one cannot invest directly in an index.
- While both fast and slow delivered positive volatility-timing alphas regardless of regime, slow had much higher market-timing alpha than fast in low-volatility regimes, whereas fast had much higher market-timing alpha than slow in high-volatility regimes—the slow signal predicts market movement better in low-volatility regimes, whereas fast signal performs better in high-volatility regimes.
- The results were robust to tests against 20 global equity indices.
Their findings led Cheng, Kostyuchyk, Lee, Liu and Ma to conclude that a dynamic momentum strategy that varies its speed based on volatility regimes delivers better out-of-sample risk-adjusted performance with less tail risk.
Investor Takeaways
A large body of evidence demonstrates that momentum, including time-series momentum (trend following), has improved portfolio efficiency. Research has found that there are a few ways to improve on simple trend-following strategies. Techniques that have been found to improve Sharpe ratios and reduce tail risk include volatility scaling and combining fast and slow signals as well as combining long-term reversals. These have been incorporated by many fund managers into investment strategies. Cheng, Kostyuchyk, Lee, Liu and Ma provided evidence that machine learning could be used to further improve results. With that said, a word of caution on the use of machine learning is warranted. The powerful tools and the easy access to data now available to researchers create the risk that machine learning studies will find correlations that have no causation and thus the findings could be nothing more than a result of torturing the data. To minimize that risk, it is important that findings not only have rational risk- or behavioral-based explanations for believing the patterns identified will persist in the future, but they also should be robust to many tests. In this case, investors could feel more confident in the results if their findings were robust to international equities and other asset classes (such as bonds, commodities and currencies).
In closing, the following advice is offered. Investors must take note of the fact that, like all risk, or factor-based, strategies, time-series momentum strategies have gone through long periods of underperformance (see Wes Gray’s excellent article demonstrating this point here). Thus, before implementing a time-series momentum strategy, you must be confident that you will be able to remain disciplined, staying the course.
Postscript
For those interested in more research on short-term momentum, Marat Molyboga, Junkai Qian and I examined the evidence in our paper “Short-Term Trend: A Jewel Hidden in Daily Returns,” published in the November 2020 issue of The Journal of Portfolio Management.
Important Disclosures
For informational and educational purposes only and should not construed as specific investment, accounting, legal, tax advice. Certain information is based upon third party information and may become outdated or otherwise superseded without notice. Third party information is deemed to be reliable, but its accuracy and completeness cannot be guaranteed. By clicking on any of the links above, you acknowledge that they are solely for your convenience, and do not necessarily imply any affiliations, sponsorships, endorsements or representations whatsoever by us regarding third-party websites. We are not responsible for the content, availability or privacy policies of these sites, and shall not be responsible or liable for any information, opinions, advice, products or services available on or through them. The opinions expressed by featured authors are their own and may not accurately reflect those of the Buckingham Strategic Wealth®. This article is for general information only and is not intended to serve as specific financial, accounting or tax advice. Neither the Securities and Exchange Commission (SEC) nor any other federal or state agency have approved, determined the accuracy, or confirmed the adequacy of this article. LSR-22-246
About the Author: Larry Swedroe
—
Important Disclosures
For informational and educational purposes only and should not be construed as specific investment, accounting, legal, or tax advice. Certain information is deemed to be reliable, but its accuracy and completeness cannot be guaranteed. Third party information may become outdated or otherwise superseded without notice. Neither the Securities and Exchange Commission (SEC) nor any other federal or state agency has approved, determined the accuracy, or confirmed the adequacy of this article.
The views and opinions expressed herein are those of the author and do not necessarily reflect the views of Alpha Architect, its affiliates or its employees. Our full disclosures are available here. Definitions of common statistics used in our analysis are available here (towards the bottom).
Join thousands of other readers and subscribe to our blog.