Value and momentum are two of the most powerful explanatory factors in finance. Research on both has been published for over 30 years(1). However, it was not until recently that the two had been studied in combination and across markets. Bijon Pani and Frank Fabozzi contribute to the literature with their study “Finding Value Using Momentum,” published in The Journal of Portfolio Management Quantitative Special Issue 2022, in which they examined whether using six value metrics that have an established academic background combined with the trend in relative valuations provide better risk-adjusted returns than Fama-French’s traditional HML (high minus low book-to-market ratio) factor. The value metrics chosen were book value-to-market value; cash flow-to-price; earnings before interest, taxes, depreciation, and amortization (EBITDA)-to-market value; earnings-to-price; profit margin-to-price; and sales-to-price. Using six different measures provides tests of robustness, minimizing the risk of data mining. However with so many dials to turn there is a risk of achieving positive returns that aren’t material or achieving positive results with the potential for overfitting.
They also used trends in the ratios to determine if they contain incremental information that can be used to pick value stocks and deliver alpha over common factor models. Trend was calculated using the rate of change in the value ratios over a two-year period for the base model. This change was normalized and compared with the cross-section of stocks available at a point in time. The top 20 percent of stocks were then selected every month to form an equal-weighted portfolio as the base model (they also documented results for a market capitalization-weighted portfolio). They explained:
“The trend in value metrics ranks firms that are not just cheap compared to the cross-section but also have become cheaper (i.e., more value compared to themselves) over time. This is a novel way of measuring value in stocks.”
They used momentum with value in three different ways to determine its effectiveness: “First, the momentum score at the firm level is combined with the firm-level trend value score to construct portfolios. Second, momentum is overlaid on the composite trend value model, where the method measures the time-series momentum at a portfolio level rather than at an individual firm level. Third, we use a factor momentum model, in which the momentum of each individual trend model is measured, and the positive momentum models are combined.(2)”
Their data sample covered all U.S. stocks (excluding those below $1) listed on NYSE, AMEX, and Nasdaq and spanned the period 1965-2019. Following is a summary of their key findings:
- Taken singly, price-to-earnings may not be the best way to filter stocks for value, but it has an additive property, and combining it with other value parameters shows its potential to help pick stocks when most other value ratios are performing poorly—multiple value metrics are superior to a single metric.
- The use of trends in fundamental ratios helps capture value in a stock portfolio in a new way—the trend in value metrics ranks firms that are not just cheap compared to the cross-section but also those that have become cheaper over time.
- The relative value method proves effective for individual value parameters and when combined to create a composite value model.
- Trends carry incremental information not captured by common factor models and control variables, adding alpha.
- Time-series regression of equal-weighted and aggregate firm-score trend models when controlling for the Fama-French five-factor model with momentum produced a monthly alpha of 1.14 percent and 1.19 percent, respectively.
The following table from the study shows the risk-return statistics for individual value trend models that were constructed using the two-year change in the individual value ratios of a firm over the period 1965-2019:

The results are hypothetical results and are NOT an indicator of future results and do NOT represent returns that any investor actually attained. Indexes are unmanaged, do not reflect management or trading fees, and one cannot invest directly in an index.
The following table (also from the study) shows the regression of individual value trend models against the Fama-French six-factor model (market beta, size, profitability, investment, value and momentum):

Regression of Individual Value Trend Models against Fama-French Six-Factor Model
NOTES: Monthly alphas and betas for the time period of January 1965 to December 2019. SMB, HML, RMW, CMA, and (Mkt − Rf) are the Fama-French size, value, profitability, investment, and market excess return factors; Rf is the risk-free rate, and MOM is the momentum factor returns. The t-statistics are presented in parentheses. Significant at the ***1%, **5% and *10% levels.
The results are hypothetical results and are NOT an indicator of future results and do NOT represent returns that any investor actually attained. Indexes are unmanaged, do not reflect management or trading fees, and one cannot invest directly in an index.
Their findings led Pani and Fabozzi to conclude:
“The advantage of a composite model over a single value measure is that it avoids model specification risks. The trend in fundamental ratios helps capture relative value in a stock portfolio. The trend in a firm’s value metrics ranks firms that are not just cheap compared to the cross-section but also have become cheaper over time. … The results show that this method proves effective for individual value parameters and when combined to create a composite value model.”
Pani and Fabozzi’s findings are consistent with those of prior research (but also subject to bias outlined by Novy-Marx). We will examine the findings from two studies published in leading peer-reviewed journals.
Prior Research
The study “Value and Momentum Everywhere” by Clifford Asness, Tobias Moskowitz, and Lasse Pedersen, which appeared in the June 2013 issue of The Journal of Finance, examined the value and momentum factors across eight markets and asset classes (individual stocks in the United States, the U.K., continental Europe, and Japan, as well as country equity index futures, government bonds, currencies and commodity futures). Following is a summary of their findings:
- There were significant return premiums to value and momentum in every asset class. The value premium was persistent in every stock market, with the strongest performance in Japan. The momentum premium was also positive in every market, especially in Europe, although statistically insignificant in Japan.
- Value strategies were positively correlated with other value strategies across otherwise unrelated markets. Momentum strategies were positively correlated with other momentum strategies globally. This persistence assuages data-mining concerns.
- Value and momentum were negatively correlated with each other within and across asset classes. The negative correlation between value and momentum within each asset class was consistent and averaged -0.49. For stocks alone, the correlation averaged -0.60. Value and momentum’s negative correlation and high positive expected returns imply that a simple combination of the two is much closer to the efficient frontier than either strategy alone. Combining value and momentum strategies results in improved Sharpe ratios.
- There is significant evidence that liquidity risk is negatively related to value and positively related to momentum globally across asset classes. The implication, in this case, is that part of the negative correlation between value and momentum is driven by opposite-signed exposure to liquidity risk. However, liquidity risk can only explain a small fraction of the value and momentum return premiums and co-movement.
The authors offered this explanation for why momentum loads positively on liquidity risk and value loads negatively:
“A simple and natural story might be that momentum represents the most popular trades, as investors chase returns and flock to the assets whose prices appreciated most recently. Value, on the other hand, represents a contrarian view. When a liquidity shock occurs, investors engaged in liquidating sell-offs (due to cash needs and risk management) will put more price pressure on the most popular and crowded trades, such as high momentum securities, as everyone runs for the exit at the same time, while the less crowded contrarian/value trades will be less affected.”
Victor Haghani and Richard Dewey, authors of “A Case Study for Using Value and Momentum at the Asset Class Level,” published in the Spring 2016 issue of The Journal of Portfolio Management, also found that combining the value and momentum factors can offer both higher expected returns and lower risk than when they are used independently.
The authors explained that the benefit comes primarily from value and momentum’s tendency to operate over different time horizons. They wrote:
“The negative correlation arises from value investing’s reliance on reversion to fair value (i.e., negative autocorrelation), while momentum investing is predicated on divergence from the mean (i.e., positive autocorrelation). Often, momentum acts as a check on value, discouraging an investor from buying before a bottom or selling before a peak.”
Their study covered the period 1975 through 2013 and included data from the following 12 asset classes: U.S. equities, U.K. equities, Europe ex-U.K. equities, Japan equities, Pacific ex-Japan equities, Canada equities, emerging market equities, U.S. REITs, commodities (as represented by the Goldman Sachs Commodity Index), U.S. nominal Treasuries, U.S. investment-grade credit and 90-day Treasury bills. Importantly, all the preceding asset classes are liquid and can be accessed with low-cost vehicles.
Unlike much research, the authors built long-only portfolios, which forced them to choose “fair value” centering points for their valuation signal. They noted:
“Intuitively, these centering points should be thought of as asset valuations that provide fair compensation for bearing the risk associated with a specific asset class.” At the end of each month, Haghani and Dewey derived valuation signals for each asset class. If the signal was above (below) that centering point, signaling undervaluation (overvaluation), they increased (decreased) the allocation relative to its baseline weight in the subsequent month and vice versa.
The authors explained:
“There is no consensus in the literature or by practitioners on the ideal metric or level for measuring valuation in each asset class. In deriving our centering points, we attempted to balance common sense practitioner metrics with the findings in the asset-pricing literature. In an effort to reduce bias, we tried to select these centering points ex-ante and did not change or optimize them at any point in the research.”
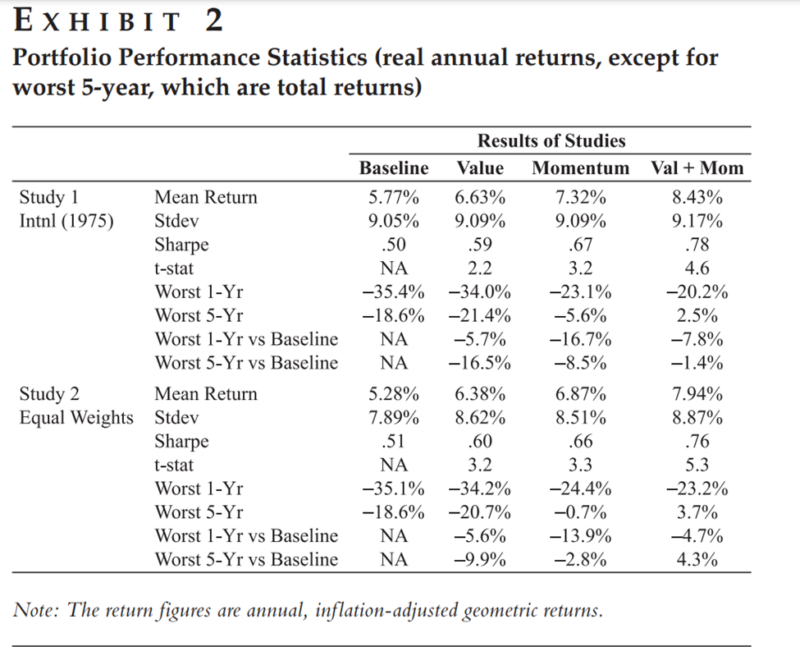
Haghani and Dewey constructed four portfolios at the end of each month: baseline (no adjustment), value, momentum, and value plus momentum. Rather than give equal weight to each asset class, they followed approximately a 65/35 (equities/bonds) portfolio construction method. They also constructed a portfolio that gave equal weight to each asset class: 20 percent equities, 20 percent real estate, 20 percent commodities, 20 percent bonds, and 20 percent T-bills.
This is a basic summary of their construction methodology: For their baseline portfolio, they rebalanced at the end of each month. For valuation measures, they scaled exposure by the asset’s valuation, giving higher weight to the cheaper assets. They increased an asset’s weight by one-half if the momentum signal was positive and decreased the weight by one-half if it was negative (then repeated the process monthly). Following is a summary of their findings:
- Valuation-based scaling of asset allocations produced a return that exceeded a static-weight portfolio by 0.86 percent per annum.
- Momentum-based scaling of asset allocations produced a return that exceeded a static-weight portfolio by 1.55 percent per annum, almost twice as large as the benefit from scaling value.
- The combination of these two portfolio adjustments produced a return that exceeded the static-weight portfolio by 2.66 percent per annum.
- The dynamically scaled portfolios also produced higher Sharpe ratios and reduced risk as measured by maximum drawdowns.
- There was no asset class for which value and momentum scaling together diminished returns.
- The outperformance was particularly high in bear markets, at 6.51 percent per annum.
- Correlations between value and momentum were negative in every case with the exception of Japanese equities, demonstrating that value and momentum are complementary in portfolios.
The results are hypothetical results and are NOT an indicator of future results and do NOT represent returns that any investor actually attained. Indexes are unmanaged, do not reflect management or trading fees, and one cannot invest directly in an index.
Haghani and Dewey observed that their portfolios did not employ leverage (explicitly or implicitly through the use of futures or derivatives), did not take short positions and did not allow for the significant concentration of risk in a small subset of the asset classes. This makes their results relevant for practitioners, who often face similar restrictions.
They also noted that when they extended their study back to 1926, using a more limited set of assets, the results were consistent. And finally, while their study ignored transaction costs, turnover was not high enough to significantly impact the results, especially because (as mentioned above) all the investments they examined could be made in low-cost, highly liquid vehicles.
The annual turnover for the baseline portfolio was roughly 15 percent, arising from the monthly rebalancing back to fixed weights. Turnover for the baseline plus value portfolio was roughly 70 percent, and turnover for the baseline plus value plus momentum portfolio was just more than 100 percent per annum.
Haghani and Dewey concluded:
“Using simple measures of valuation and momentum to dynamically adjust asset allocation has historically produced superior investment returns compared to a more static investment strategy. … We find that a strategy employing value and momentum together provides higher quality returns than using either value or momentum alone. This can be attributed to negative correlation and the general complementary nature of value and momentum.”
Investor Takeaways
The research demonstrates that using multiple measures of value and combining value and momentum in a strategy has produced superior results compared to using either the traditional HML value factor or the traditional momentum factor independently. Such findings explain why fund sponsors increasingly use multiple value metrics and combine them with momentum strategies in a single fund. Pani and Fabozzi contribute to the literature by providing a new method to measure value using fundamental momentum and various ways of combining momentum. As they noted:
“This should be useful to academics and practitioners because it can be adapted to build investment strategies and asset pricing models.”
Finally, a word of caution is warranted. As explained in this Alpha Architect article: “One of the dangers of being a quantitative investor is that when you see patterns in historical data you might wrongly assume they will repeat. Put another way, you might believe an effect is driven by a genuine relationship when in reality the results are spurious and the result of luck.” Not only do you have to consider the risk of selection bias (otherwise known as data mining)—a researcher considers many signals and only reports the best performing signal—but also the risk of overfitting bias—a researcher uses all the signals considered but optimizes for a combination of signals. The result can be a signal with no predictive value.
As explained in the article:
“Selection bias can magnify the effects of overfitting, in an exponential fashion, consistent with a power law.”
The takeaway is that you should at least be suspicious of any multi-signal strategy you may come across in the market because the statistical bar gets very high very quickly. Be careful to check to determine if the strategy meets all of the criteria Andrew Berkin and I suggested be met before investing in a factor-based strategy: The factor must have generated a premium that has been persistent over long periods of time and across economic regimes, has been pervasive around the globe, is robust to various definitions, is implementable and has intuitive risk- or behavioral-based explanations that convince you the premium is likely to persist. Pani and Fabozzi provided domestic evidence supporting their strategy. It would be good to see an out-of-sample test using international data.
Important Disclosures
For informational and educational purposes only and should not be construed as specific investment, accounting, legal, or tax advice. Indices are not available for direct investment. Their performance does not reflect the expenses associated with the management of an actual portfolio nor do indices represent results of actual trading. Total return includes reinvestment of dividends and capital gains. Certain information is based upon third party data which may become outdated or otherwise superseded without notice. Third party information is deemed to be reliable, however its accuracy and completeness cannot be guaranteed. By clicking on any of the links above, you acknowledge that they are solely for your convenience, and do not necessarily imply any affiliations, sponsorships, endorsements or representations whatsoever by us regarding third-party websites. We are not responsible for the content, availability or privacy policies of these sites, and shall not be responsible or liable for any information, opinions, advice, products or services available on or through them. The opinions expressed by featured authors are their own and may not accurately reflect those of the Buckingham Strategic Wealth® or Buckingham Strategic Partners®, collectively Buckingham Wealth Partners. Neither the Securities and Exchange Commission (SEC) nor any other federal or state agency have approved, determined the accuracy, or confirmed the accuracy of this article. LSR-22-224
About the Author: Larry Swedroe
—
Important Disclosures
For informational and educational purposes only and should not be construed as specific investment, accounting, legal, or tax advice. Certain information is deemed to be reliable, but its accuracy and completeness cannot be guaranteed. Third party information may become outdated or otherwise superseded without notice. Neither the Securities and Exchange Commission (SEC) nor any other federal or state agency has approved, determined the accuracy, or confirmed the adequacy of this article.
The views and opinions expressed herein are those of the author and do not necessarily reflect the views of Alpha Architect, its affiliates or its employees. Our full disclosures are available here. Definitions of common statistics used in our analysis are available here (towards the bottom).
Join thousands of other readers and subscribe to our blog.