Abstract: The “Intangible Value Factor” (IHML) can play an additive role in factor portfolios alongside the established market, size, value, quality, and momentum factors. This Six-Factor Model avoids the problematic “anti-innovation” bias of traditional factor portfolios and can be easily implemented using ETFs.
This post is a summary of the recently published paper Intangible Value: A Sixth Factor (May 2023).
Intangible Value as a Factor
Over the past few decades, intangible assets have grown in importance. Intangible assets, such as intellectual property, brand equity, human capital, and network effects, are now the primary drivers of value for modern firms. The rise of the intangible economy has far-reaching implications for investors. Most notably, we believe it is responsible for the ongoing struggles of the widely-used “Value Factor” (e.g., price / book value).
To address this problem, we have spent the past few years building dozens of firm-level intangible value metrics. Rather than rely on accounting data, which we believe are inherently limited, we utilize alternative data (e.g., job posts, patents, social media). Since these data are often unstructured, we first convert them into structured factors using natural language processing (a la ChatGPT). From here, we combine them into the four intangible pillars and then into a single composite “Intangible Value Score.”
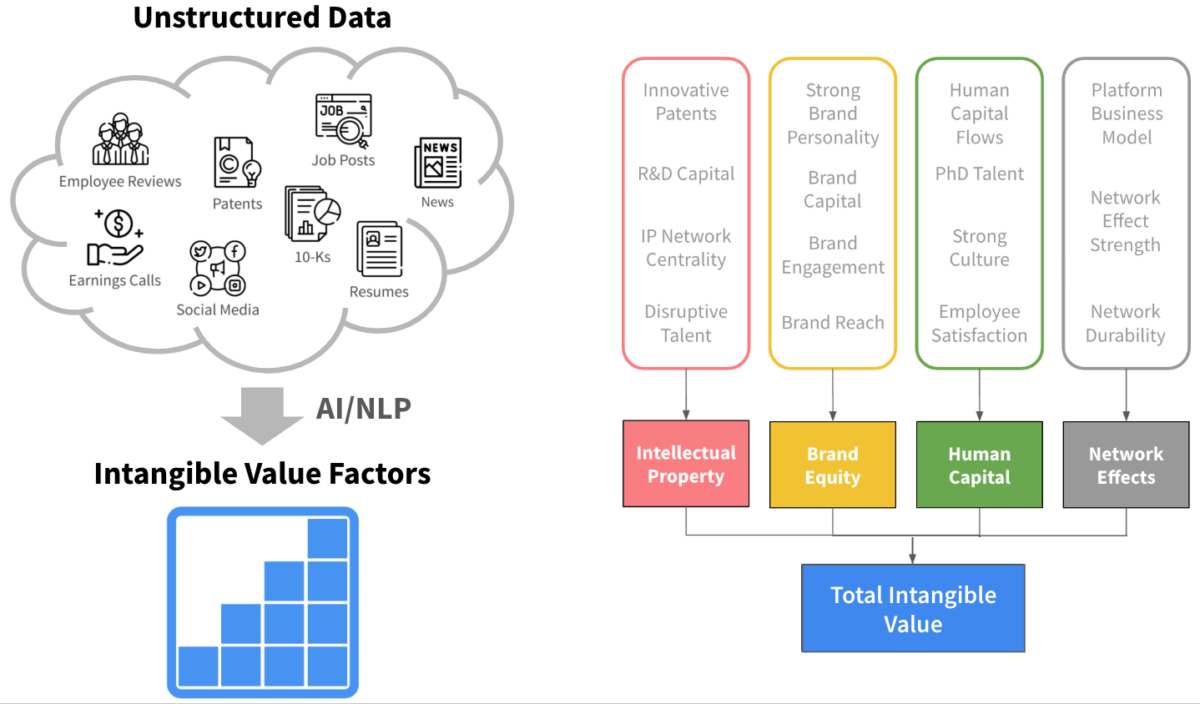
Source: Sparkline. For illustrative purposes only.
Our most recent paper merges our intangible value research into the factor investing canon. To do so, we follow the methodology used in Fama and French (1993) to construct an “Intangible Value Factor.” The factor buys U.S. stocks with high Intangible Value Scores and sells those with low scores.
We study the Intangible Value Factor alongside five popular factors (from Ken French’s website).
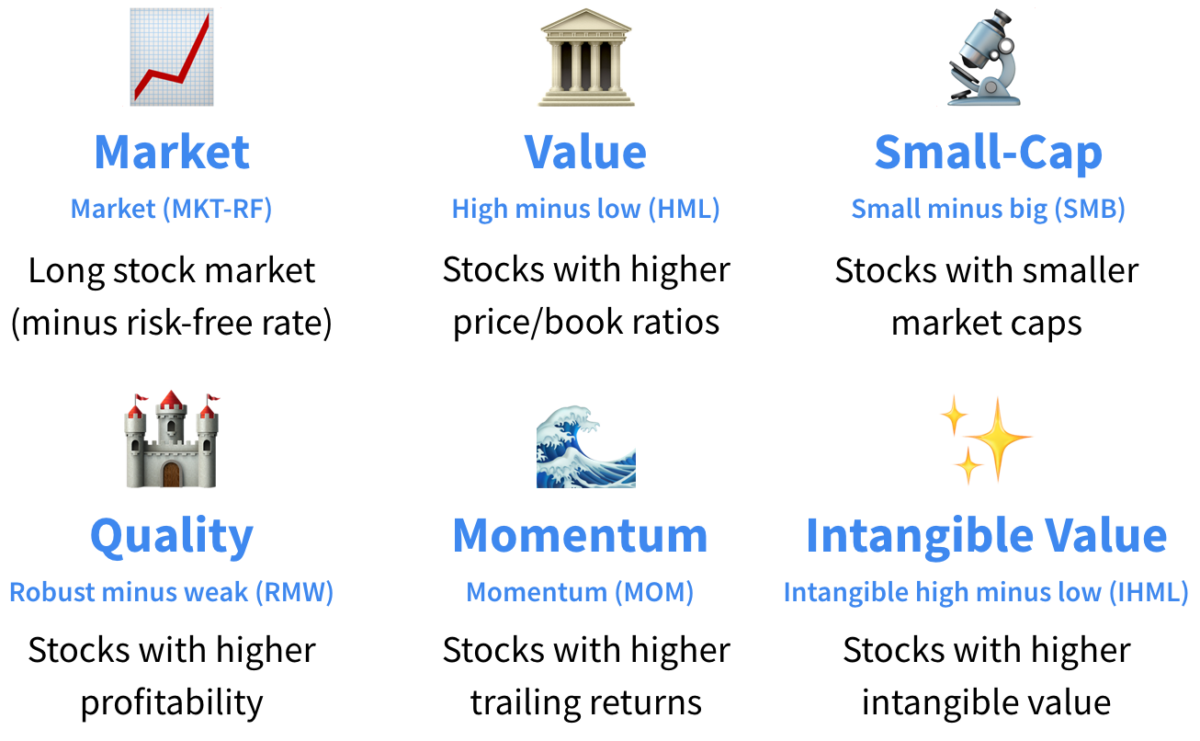
Source: Ken French, Sparkline. See complete definitions below.
All six factors have enjoyed historical (backtested!) excess returns.
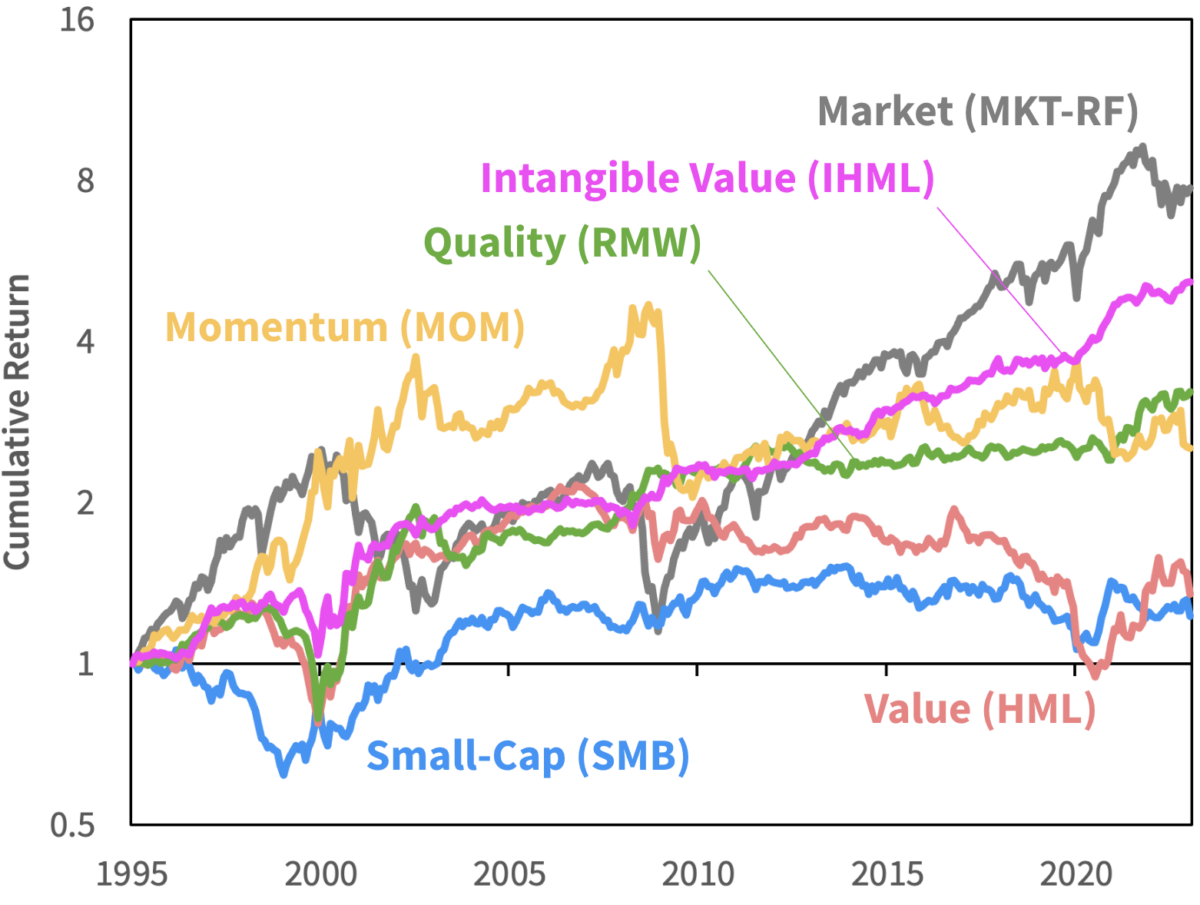
Source: Ken French, Sparkline. Market and long-short portfolios constructed per the Fama-French Rm-Rf, HML, SMB, RMW, and MOM factors. Intangible Value follows the HML methodology except it uses the intangible value factor. Analysis includes both large- and small-cap stocks. No transaction or financing costs. From 3/31/1995 to 3/31/2023. See more complete definitions and important backtest disclosure below. The results are hypothetical results and are NOT an indicator of future results and do NOT represent returns that any investor actually attained. Indexes are unmanaged and do not reflect management or trading fees, and one cannot invest directly in an index.
The Six-Factor Model
Importantly, the Intangible Value Factor has low correlations with the other factors. While varying over time, the average correlation ranges from -14% to +11%. Intangible Value can truly be considered a distinct “sixth factor.”
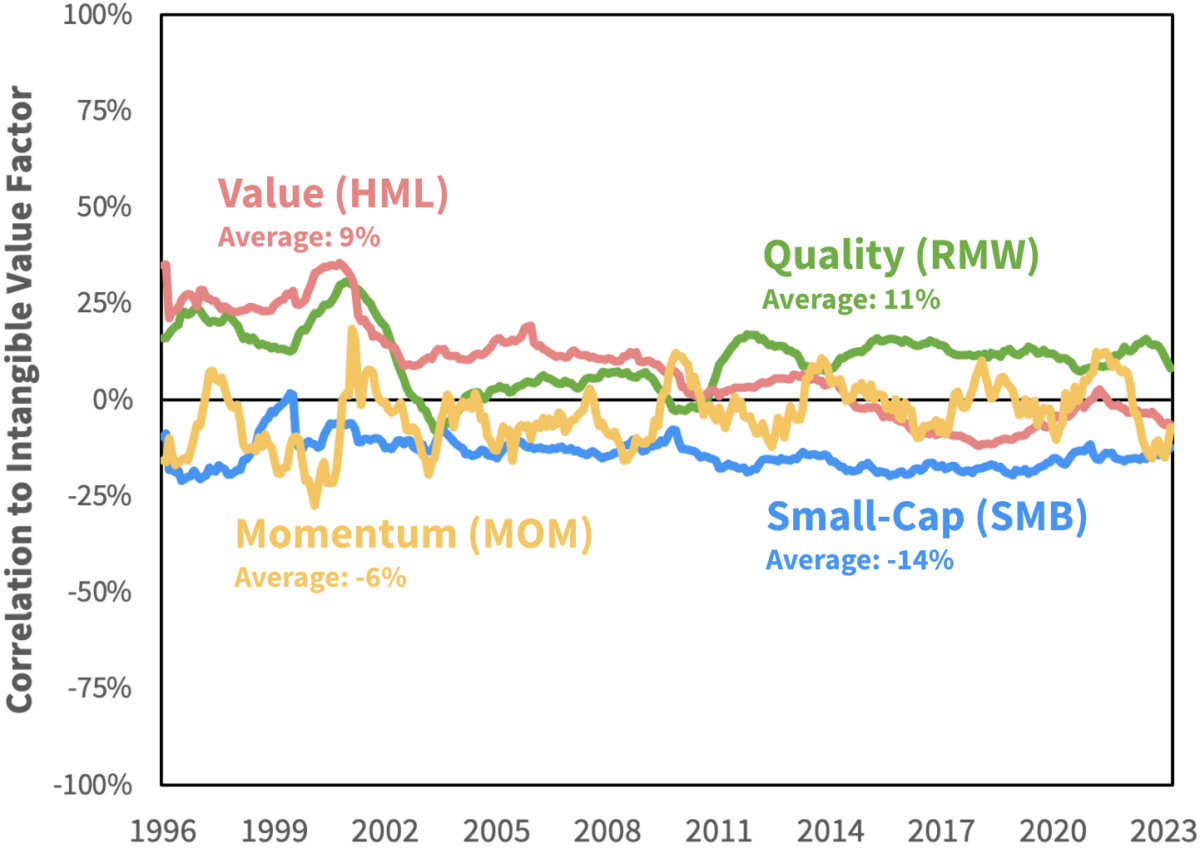
Source: Ken French, Sparkline. Cross-sectional position-level correlations between Intangible Value and other factors. All factors are themselves cross-sectionally normalized within the top 3000 U.S. stocks. From 12/31/1995 to 3/31/2023. The results are hypothetical results and are NOT an indicator of future results and do NOT represent returns that any investor actually attained. Indexes are unmanaged and do not reflect management or trading fees, and one cannot invest directly in an index.
It’s worth pausing briefly to consider the intuition behind these low correlations:
- Why are Value and Intangible Value uncorrelated? While ideological twins, they focus on opposing parts of the balance sheet. This results in two very different sets of companies. Value favors capital-intensive banks and manufacturers, while Intangible Value prefers asset-light tech platforms and brands.
- Why are Quality and Intangible Value uncorrelated? Both seek firms with wide moats, which often take the form of intangible assets, such as luxury brands or drug patents. However, building intangible moats requires large upfront investments that can take years to pay off (e.g., advertising, R&D). While Quality seeks firms that are profitable today, Intangible Value seeks those investing in profitability tomorrow.
The fact that Intangible Value is uncorrelated with other factors suggests that rather than be used as a substitute for Value (or Quality), it should be used as a complement. We want all the uncorrelated, positive-expected-return factors we can get!
Next, we study the correlations between all six factors. We find that the average cross-factor correlation has been low and stable over time, even through the 2000, 2008, and 2020 crises. This implies significant diversification benefits.
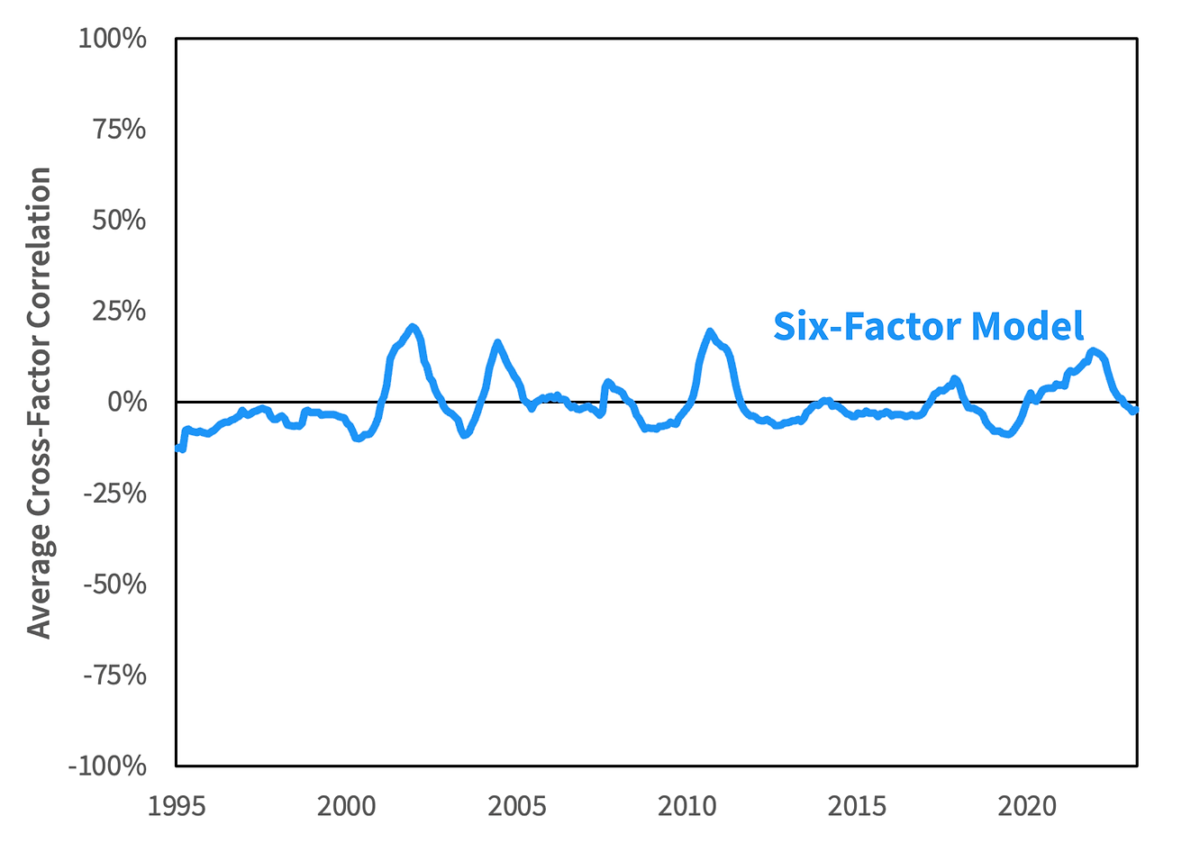
Source: Ken French, Sparkline. Rolling 252-day correlations. Average across all pairs of factors in the Six-Factor Model. From 3/31/1995 to 3/31/2023. The results are hypothetical results and are NOT an indicator of future results and do NOT represent returns that any investor actually attained. Indexes are unmanaged and do not reflect management or trading fees, and one cannot invest directly in an index.
Thus, we arrive at the Six-Factor Model. All six factors are both empirically and intuitively appealing. Moreover, since they are also uncorrelated, basic portfolio math tells us that using all six should result in a superior portfolio!
Fixing the Anti-Innovation Bet
One of the big problems with traditional factor investing is that it tends to leave investors “short innovation.” This is mainly due to the Value Factor, which is strongly biased against intangible-intensive businesses. Not giving firms such as Apple or Amazon credit for their prodigious intangible assets means they always seem expensive. This has been a losing bet the past 15 years.
One common “hack” is to simply add an allocation to Growth ETFs (e.g., QQQ, IWF, ARKK, XT). While this helps balance out Value’s anti-innovation bias, Growth funds tend to have undesirable Value and Quality exposures. We find that Intangible Value can help, providing exposure to innovation without the unwanted bet on expensive junk stocks.
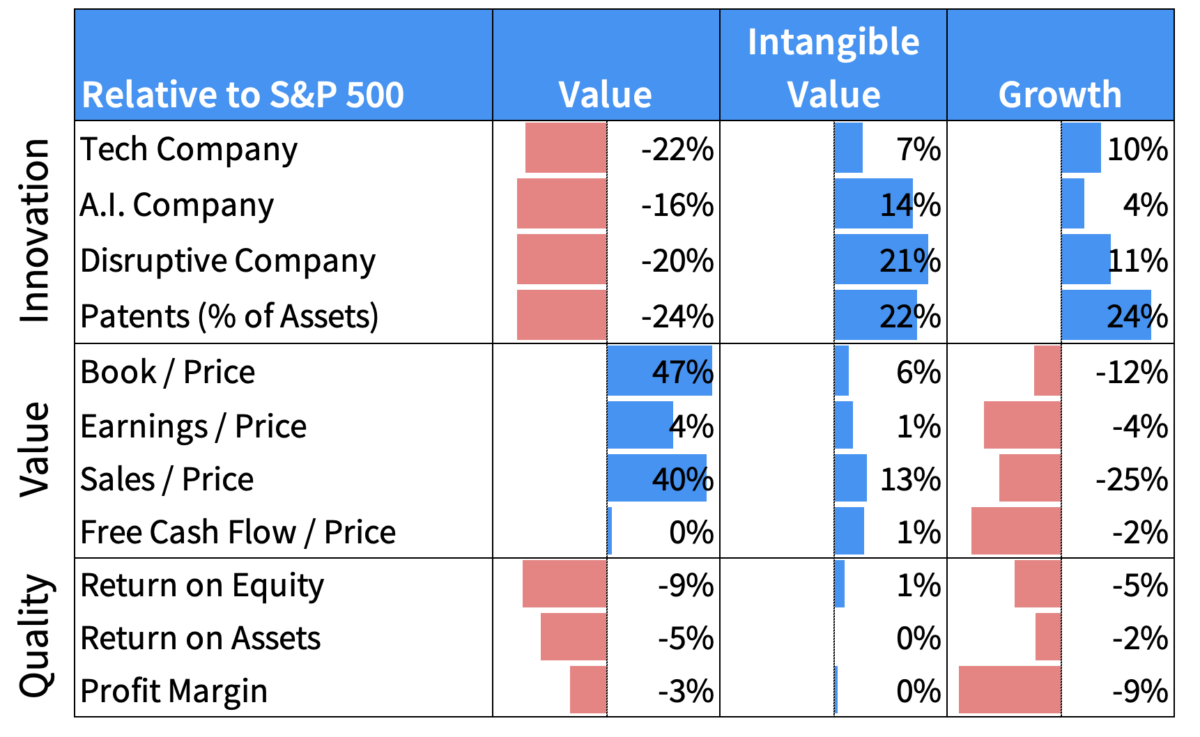
Source: S&P, USPTO, LinkedIn, Sparkline. All figures relative to S&P 500. Calculations weighted by position and do not predict performance. Tech defined as GICS IT sector. A.I. and disruptive companies defined using proprietary classifications. All other metrics are calculated over a trailing 1-year period, with the exception of prices. Patents are scaled by billions. Value is a long-only portfolio of the top tercile stocks on book/market. Intangible value is the same but using intangible value. Universe consists of the top 1000 largest U.S. stocks and portfolios are cap-weighted. Growth is an equal-weighted basket of the holdings of QQQ, IWF, ARKK, and XT. Not a recommendation to buy or sell securities. As of 3/31/2023. The results are hypothetical results and are NOT an indicator of future results and do NOT represent returns that any investor actually attained. Indexes are unmanaged and do not reflect management or trading fees, and one cannot invest directly in an index.
In fact, one way to think about the Intangible Value Factor is as an attempt to isolate the “good part” of Growth funds without the drag from overpriced junk stocks. Decomposing the returns of Growth ETFs, we find that their negative Value and Quality exposure has detracted from returns and added unwanted volatility. On the other hand, their positive exposure to Intangible Value has driven much of their historical outperformance. Arguably, Growth funds are just a backdoor bet on Intangible Value!
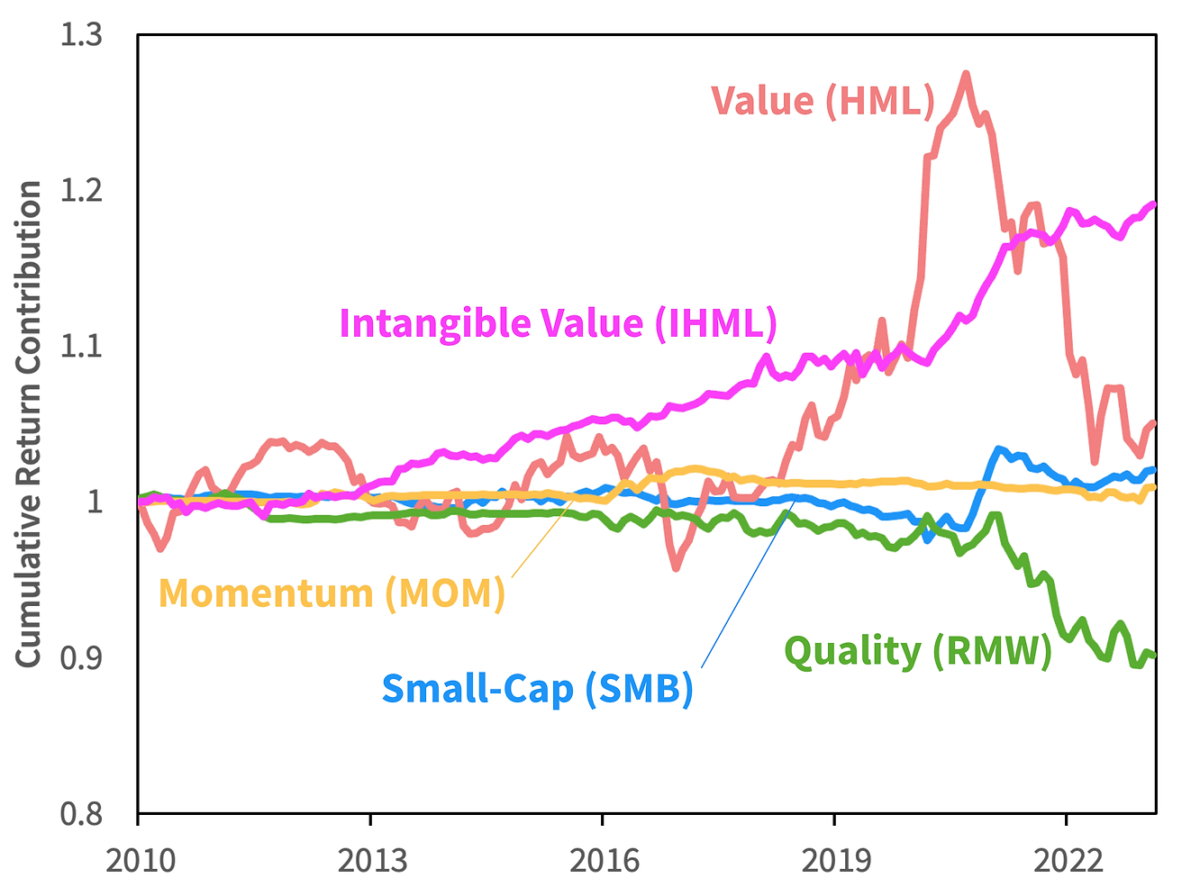
Source: S&P, Sparkline. We run rolling 750-day regressions of Growth returns on our Six-Factor model. We use the resulting factor exposures and that day’s returns to infer the contribution from each factor. We then roll forward through time to build a cumulative series. Growth is defined as an equal-weighted basket of the holdings of QQQ, IWF, ARKK, and XT. We prorate the portfolio when ARKK or XT are unavailable. Not a recommendation to buy or sell securities. From 12/31/2009 to 3/31/2023. The results are hypothetical results and are NOT an indicator of future results and do NOT represent returns that any investor actually attained. Indexes are unmanaged and do not reflect management or trading fees, and one cannot invest directly in an index.
Finally, we explore the impact of adding Intangible Value to a broader factor portfolio. We build three long-only model portfolios with varying allocations to factor and Growth funds. The traditional Five-Factor portfolio is underweight both Intangible Value and Innovation. While adding Growth funds helps plug this hole, it also reduces Value and Quality. The Six-Factor portfolio provides the best overall exposures, neutralizing the underweight to Innovation and Intangible Value without sacrificing Value or Quality.
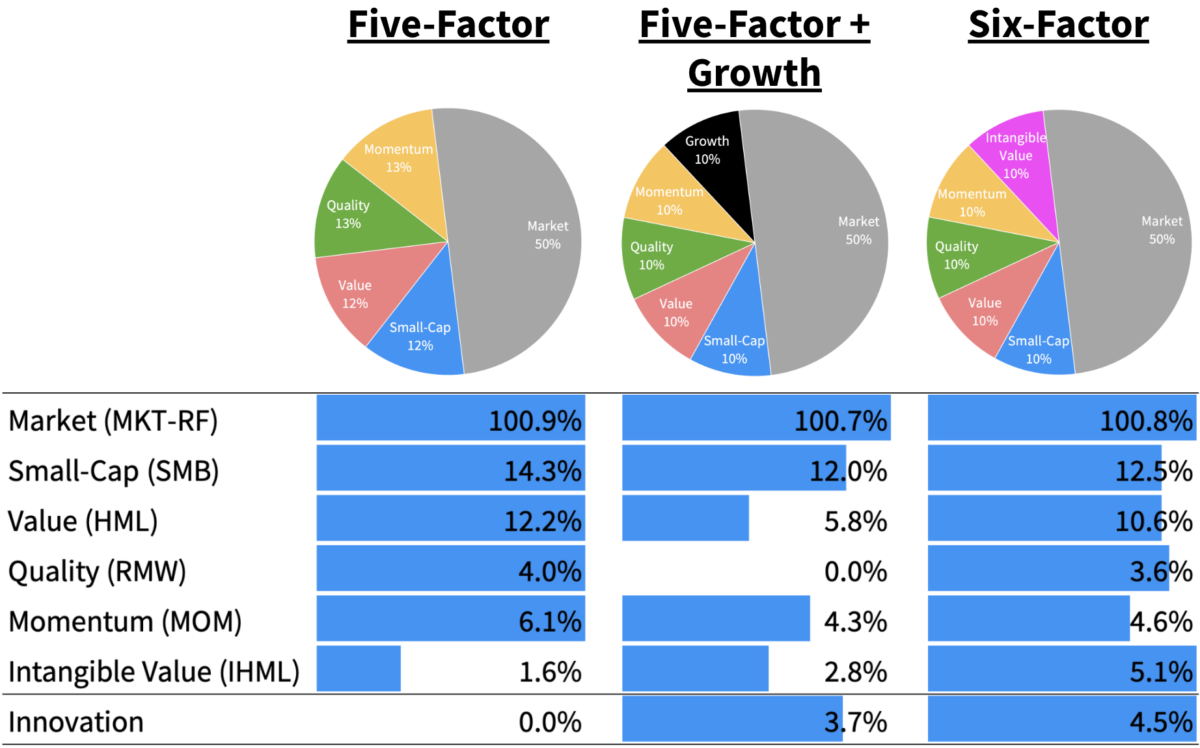
Source: S&P, Sparkline. Portfolio components are the long sides of the MKT-RF, SMB, HML, RMW, MOM and IHML factors. Growth is an equal basket of QQQ, IWF, ARKK, and XT. We compute factor loadings for each portfolio using regressions on the Six-Factor Model. Exposures shown in the table aggregate from these underlying loadings based on the weights in the pie charts above. We also show the innovation score, which we rescale so that the Five-Factor model is not negative but zero. Not a recommendation to buy or sell securities. As of 3/31/2023. The results are hypothetical results and are NOT an indicator of future results and do NOT represent returns that any investor actually attained. Indexes are unmanaged and do not reflect management or trading fees, and one cannot invest directly in an index.
For investors seeking actionable takeaways, the paper also provides guidance on implementing the Six-Factor Model portfolio using highly accessible ETFs.
For more, check out the full paper here: Intangible Value: A Sixth Factor (May 2023)
Factor Definitions
We use the Fama-French definitions for the traditional five factors. Complete definitions for MKT-RF, SMB, HML, and RMW are here and the definition for MOM is here. We construct IHML as follows:
IHML (Intangible High Minus Low) is the average return on the two high intangible value portfolios minus the average return on the two low intangible value portfolios,
IHML = 1/2 (Small High Intangible Value + Big High Intangible Value)
– 1/2 (Small Low Intangible Value + Big Low Intangible Value)
The Big universe is of the top 1,000 U.S. stocks by market cap, while the Small universe is the next 2,000. High Intangible Value is the top 33% and Low Intangible Value is the bottom 33% of stocks in the applicable universe. Portfolios are cap-weighted.
Disclaimer
This paper is solely for informational purposes and is not an offer or solicitation for the purchase or sale of any security, nor is it to be construed as legal or tax advice. References to securities and strategies are for illustrative purposes only and do not constitute buy or sell recommendations. The information in this report should not be used as the basis for any investment decisions.
We make no representation or warranty as to the accuracy or completeness of the information contained in this report, including third-party data sources. This paper may contain forward-looking statements or projections based on our current beliefs and information believed to be reasonable at the time. However, such statements necessarily involve risk and uncertainty and should not be used as the basis for investment decisions. The views expressed are as of the publication date and subject to change at any time.
Backtest Disclosure
The performance shown reflects the simulated model performance an investor may have obtained had it invested in the manner shown but does not represent performance that any investor actually attained. This performance is not representative of any actual investment strategy or product and is provided solely for informational purposes.
Hypothetical performance has many significant limitations and may not reflect the impact of material economic and market factors if funds were actually managed in the manner shown. Actual performance may differ substantially from simulated model performance. Simulated performance may be prepared with the benefit of hindsight and changes in methodology may have a material impact on the simulated returns presented.
The simulated model performance is adjusted to reflect the reinvestment of dividends and other income. Simulations that include estimated transaction costs assume the payment of the historical bid-ask spread and $0.01 in commissions. Simulated fees, expenses, and transaction costs do not represent actual costs paid.
Index returns are shown for informational purposes only and/or as a basis of comparison. Indexes are unmanaged and do not reflect management or trading fees. One cannot invest directly in an index. The S&P 500 is a popular gauge of large-cap U.S. equities that includes 500 leading companies. The Russell 1000 Index consists of the approximately top 1000 U.S. stocks by market cap. The Russell 1000 Value (Growth) Index includes those Russell 1000 companies with lower (higher) price-to-book ratios and expected and historical growth rates.
No representation or warranty is made as to the reasonableness of the methodology used or that all methodologies used in achieving the returns have been stated or fully considered. There can be no assurance that such hypothetical performance is achievable in the future. Past performance is no guarantee of future results.
About the Author: Kai Wu
—
Important Disclosures
For informational and educational purposes only and should not be construed as specific investment, accounting, legal, or tax advice. Certain information is deemed to be reliable, but its accuracy and completeness cannot be guaranteed. Third party information may become outdated or otherwise superseded without notice. Neither the Securities and Exchange Commission (SEC) nor any other federal or state agency has approved, determined the accuracy, or confirmed the adequacy of this article.
The views and opinions expressed herein are those of the author and do not necessarily reflect the views of Alpha Architect, its affiliates or its employees. Our full disclosures are available here. Definitions of common statistics used in our analysis are available here (towards the bottom).
Join thousands of other readers and subscribe to our blog.