Environmental, social, and governance (ESG) investing continues to increase in popularity, with many institutional and individual investors incorporating ESG criteria into their investment decision-making process. Three main themes have driven this massive shift of assets: 1) Many investors are motivated by nonfinancial reasons to tilt their portfolios toward firms with robust ESG criteria; 2) Others are incorporating ESG factors into portfolios because they believe them to be linked to financial performance; and 3) Investors believe that tilting their portfolios toward “green” companies, and away from “brown” or “sin” companies, reduces not only environmental risks but also risks of fraud (green companies have more robust risk controls), human rights scandals, consumer boycotts, regulatory risk, and lawsuits. Given the trend, a critical question that has not yet been addressed is if the trend affects market efficiency.
To answer that question, Jay Cao, Sheridan Titman, Eunice Zhan, and Elaine Zhang, authors of the August 2021 study “ESG Preference, Institutional Trading, and Stock Return Patterns,” published in the August 2023 issue of the Journal of Financial and Quantitative Analysis, examined how the trend toward socially responsible investing affects the informational efficiency of stock prices. They hypothesized: “Because of their preference for social performance, socially responsible institutions tend to focus more on ESG performance, and may thus react less to direct signals of firm value—the portfolio choices of socially responsible investors (SRIs) will tend to be less sensitive to quantitative signals. Moreover, if socially responsible investors have a material influence on stock prices, the efficacy of the quantitative signals should be stronger for the stocks that are more held by these investors.” Thus, their paper explored the efficiency question by examining potential links between the choices of socially responsible investors and the efficacy of the signals used by quantitative investors.
Their analysis of quantitative signals considered the standardized unexpected earnings (SUE) signal explored in the accounting literature and the composite mispricing signal described by Robert Stambaugh, Jianfeng Yu, and Yu Yuan (“SYY”) in their 2015 study “Arbitrage Asymmetry and the Idiosyncratic Volatility Puzzle,” which combined 11 different anomalies from the academic literature. Their data sample focused on 2004-2016 and the top 3,000 companies. Here is a summary of their key findings:
- The stocks held by SRIs tended to be somewhat more significant, more liquid and were followed by more analysts on average. In theory, these should have been the most efficiently priced stocks. However, the returns of the SYY strategy, which had historically been much stronger for small market capitalization stocks, were stronger for the larger capitalization stocks in the recent period, providing evidence of the effect of SRIs on price efficiency.
- Over the sample period 2004-2016, a value-weighted long-short strategy that exploited the SUE signal generated a significant risk-adjusted monthly return of 0.52% on stocks held more by SRIs. In contrast, they found a statistically insignificant risk-adjusted return of -0.18% per month for stocks held more by institutions not classified as SRIs. The signal generated significantly stronger abnormal returns for those stocks held more by SRIs even though those stocks tended to be larger and more liquid. The results using the composite SYY signal were very similar. In contrast, in the earlier 1996-2003 sample period predating the rise in ESG investing, the holdings of SRIs investors were not an indicator of the efficacy of the composite mispricing signal.
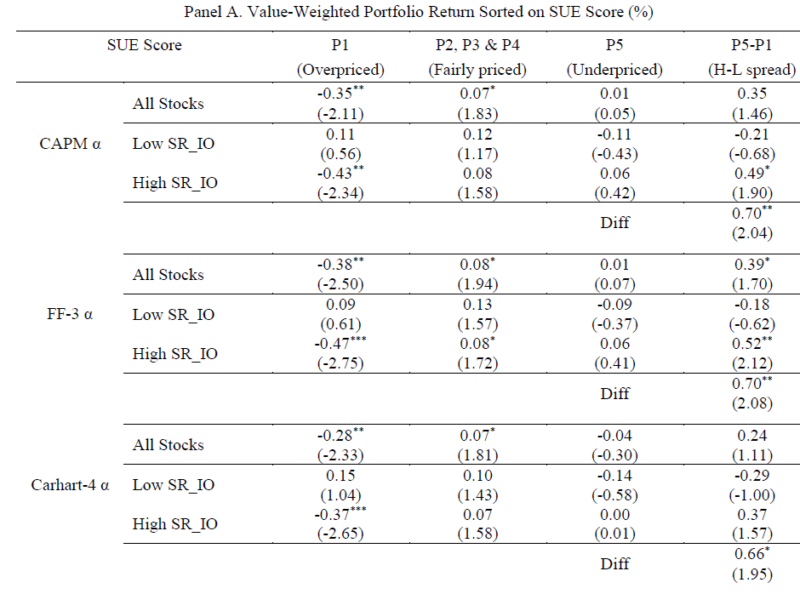
Table 3. Monthly Returns for Portfolios Independently Sorted on SR_IO (Socially responsible institutional ownership) and Mispricing Signals
This table reports the value-weighted average monthly abnormal returns (in percentage) of portfolios double sorted on socially responsible institutional ownership (SR_IO) and standardized unexpected earnings (SUE) score in Panel A, and SYY score in Panel B. SUE score is computed as the difference between current quarter’s earnings and the earnings four quarters ago, then divided by the standard deviation of unexpected earnings over the last eight quarters. SYY score for a stock is the opposite of mispricing score in Stambaugh, Yu, and Yuan (2015). To calculate SR_IO, we first calculate value-weighted size-adjusted ESG score as socially responsible score for all the institutions. Then we define socially responsible (SR) institutions (one third of all) based on their score. SR_IO is the number of shares held by SR institutions divided by the total number of shares held by all the institutions. In Panel A, at the end of each month, all available stocks are sorted into five quintiles based on the most recent SUE score within previous three months. P5 refers to the stocks with the highest SUE score (most “underpriced”) and stocks in P1 are those with the lowest SUE score (most “overpriced”). In Panel B, at the end of each month, all available stocks are sorted into five mispricing quintiles based on the SYY score of last month. P5 refers to the most “underpriced” stocks and stocks in P1 are the most “overpriced”. Then the stocks are independently sorted into low and high SR_IO groups in both panels based on the SR_IO of previous quarter. We report value-weighted CAPM alpha, Fama-French (1993) three-factor alpha, and Carhart (1997) four-factor alpha of all the portfolios for the next month. In addition, we report: 1) High-minus-low spread based on mispricing signals for all stocks, low SR_IO group, and high SR_IO group; 2) Difference of high-minus-low spread between low SR_IO group and high SR_IO group. The sample period is from January 2004 to December 2016. To adjust for serial correlation, robust Newey-West (1987) t-statistics are reported in parentheses.
The results are hypothetical results and are NOT an indicator of future results and do NOT represent returns that any investor actually attained. Indexes are unmanaged and do not reflect management or trading fees, and one cannot invest directly in an index.
- The return spread was significant for the high SRI stocks but not for the low SRI stocks, with the differences in spreads ranging from 0.66% to 0.70% per month for the SUE metric and 0.55% for the SYY metric.
- Non-SRIs adjusted their portfolios more for both the top and bottom SUE quintiles compared with the SRIs—non-SRIs reacted much stronger toward SUE scores.
- Their results mainly came from stocks with high SRI holdings with unfavorable quantitative signals.
- Using the Google Search Volume Index, their results were stronger in periods when public attention to ESG issues was greater. They also found that their results were stronger among firms headquartered in Democratic-leaning (blue) states than firms in Republican-leaning (red) states. However, neither finding was statistically significant.
- There was no systematic evidence of mispricing, regardless of ESG scores, for stocks primarily held by non-socially responsible investors, and socially responsible institutions were less likely to buy underpriced stocks with bad ESG performance or sell overpriced stocks with good ESG performance.
- The return predictability of mispricing signals was much stronger among firms held by more socially responsible institutions. The divergence of trading implications from ESG performance and mispricing signals drove the results.
- The inefficiency only emerged in recent years with the rise of ESG investing and has not been fully offset by ESG-neutral arbitrageurs due to funding liquidity constraints.
- The inefficiency caused by SRIs was only observed when arbitrage capital was tight.
- They did not find evidence of higher direct costs associated with shorting stocks with high SR holdings. Still, they did find that there were fewer public short-sale campaigns and more negative reactions to these campaigns on social media for stocks with high SRI holdings.
- The SYY score predicted future stock returns more reliably for stocks held more by SR active mutual funds.
Their findings led the authors to conclude: “Our analysis suggests that SR institutions can influence informational efficiency of stock prices, which can also affect corporate financing and investment choices.” They also noted that socially responsible mutual funds can charge higher fees, explaining why some mutual funds may rationally focus more on indicators of ESG and perhaps less on quantitative mispricing signals.
Investor Takeaways
The evidence demonstrates that due to their preference for high ESG stocks, ESG investors tend to trade differently than their less socially responsible peers. They exhibit lower turnover, and their portfolio choices appear less sensitive to earnings surprises and other quantitative mispricing signals. Because of their different trading behaviors, ESG investors have had an important influence on the efficacy of mispricing signals. The reviewed findings support those of Eugene Fama and Kenneth French, who showed in their 2007 study “Disagreement, Tastes, and Asset Prices” how disagreement and taste for assets as consumption goods can affect asset prices.
In our book “Your Essential Guide to Sustainable Investing,” Sam Adams and I explained that economic theory suggests that if a large enough proportion of investors choose to favor companies with high sustainability ratings and avoid those with low sustainability ratings (sin businesses), the favored company’s share prices will be elevated and the sin stock shares will be depressed. In equilibrium, the screening out of certain assets based on investors’ tastes should lead to a return premium on the screened assets.
The result is that the favored companies will have a lower cost of capital because they will trade at a higher P/E ratio. The flip side of a lower cost of capital is a lower expected return to the providers of that capital (shareholders). And the sin companies will have a higher cost of capital because they will trade at a lower P/E ratio, the flip side of which is a higher expected return to the providers of that capital.
The hypothesis is that the higher expected returns (a premium above the market’s required return) are required as compensation for the emotional cost of exposure to offensive companies. On the other hand, investors in companies with higher sustainability ratings are willing to accept the lower returns as the cost of expressing their values.
There is also a risk-based hypothesis for the sin premium. It is logical to hypothesize that companies neglecting to manage their ESG exposures could be subject to greater risk (a wider range of potential outcomes) than their more ESG-focused counterparts. The argument is that companies with high sustainability scores have better risk management and better compliance standards. The stronger controls lead to fewer extreme events such as environmental disasters, fraud, corruption, and litigation (and their negative consequences). The result is a reduction in tail risk in high-scoring firms relative to the lowest-scoring firms. The greater tail risk creates the sin premium.
The major takeaway for investors is that the evidence presented is consistent with the economic theory. Thus, while ESG investors can express their values through their investments, they should expect lower returns from their portfolios—though they also will be taking less investment risk.
Larry Swedroe is the author or co-author of 18 books on investing, including his latest Enrich Your Future. For informational and educational purposes only and should not be construed as specific investment, accounting, legal, or tax advice. Neither the Securities and Exchange Commission (SEC) nor any other federal or state agency have approved, determined the accuracy, or confirmed adequacy of this article. Certain information may be based on third party data and may become outdated or otherwise superseded without notice. Third party information is deemed to be reliable, but its accuracy and completeness cannot be guaranteed. By clicking on any of the links above, you acknowledge that they are solely for your convenience, and do not necessarily imply any affiliations, sponsorships, endorsements or representations whatsoever by us regarding third-party websites. Buckingham is not responsible for the content, availability or privacy policies of these sites, and shall not be responsible or liable for any information, opinions, advice, products or services available on or through them. The opinions expressed here are their own and may not accurately reflect those of Buckingham Wealth Partners. LSR-23-554
About the Author: Larry Swedroe
—
Important Disclosures
For informational and educational purposes only and should not be construed as specific investment, accounting, legal, or tax advice. Certain information is deemed to be reliable, but its accuracy and completeness cannot be guaranteed. Third party information may become outdated or otherwise superseded without notice. Neither the Securities and Exchange Commission (SEC) nor any other federal or state agency has approved, determined the accuracy, or confirmed the adequacy of this article.
The views and opinions expressed herein are those of the author and do not necessarily reflect the views of Alpha Architect, its affiliates or its employees. Our full disclosures are available here. Definitions of common statistics used in our analysis are available here (towards the bottom).
Join thousands of other readers and subscribe to our blog.