Momentum is the tendency for assets that have performed well (poorly) in the recent past to continue to perform well (poorly) in the future, at least for a short period of time. In 1997, Mark Carhart, in his study, “On Persistence in Mutual Fund Performance,” was the first to use momentum, together with the three Fama–French factors (market beta, size and value), to explain mutual fund returns. Initial research on momentum was published by Narasimhan Jegadeesh and Sheridan Titman, authors of the 1993 study, “Returns to Buying Winners and Selling Losers: Implications for Stock Market Efficiency.”(1)
Momentum is most commonly defined as the last 12 months of returns excluding the most recent month (in other words, months two through 12 of the past year). The most recent month is excluded, as it tends to show a reversal, which some have attributed to microstructure (trading) effects. The momentum factor is the average return of the top 30 percent of stocks minus the average return of the bottom 30 percent as ranked by this measure. The momentum factor is referred to as UMD, or up minus down. Note that UMD is a relative (cross-sectional) measure of momentum, unlike trend-following momentum, which is an absolute measure.
Cross-sectional momentum has been found to be persistent across time and economic regimes; pervasive around the globe and across stocks, industries, bonds, commodities and currencies; robust to various definitions; and has well-documented behavioral explanations for why it has persisted even after publication. And, with the use of patient trading strategies, it survives transaction costs.(2)(3)(4)
Introducing Factor Momentum
Rob Arnott, Mark Clements, Vitali Kalesnik and Juhani Linnainmaa contribute to the literature on momentum with their January 2018 study “Factor Momentum.” The authors identified 51 factors in the academic literature found to be significant predictors of stock returns and showed that factor momentum is not only stronger than the previously documented industry momentum, it fully subsumes it. The data sample covers the period from July 1963 through 2016.
The following is a summary of their findings:
- Almost any set of factors exhibits momentum. Factor momentum is pervasive.
- Some factors contribute significantly more toward factor momentum profits than others, but no factor significantly lowers these profits.
- Factor momentum’s abnormal returns are not specific to any one part of the 1963 through 2016 sample period. It’s persistent.
- When stock momentum crashed at the onset of market recovery in 2009, factor momentum generated sudden and outsized profits. It’s unique.
- A strategy that rotates all 51 factors based on their prior one-month returns and holds them for a month earns an annualized average return of 10.5 percent with a t-value of 5.01.
- A strategy that uses industry-adjusted factors earns an average return of 6.4 percent with a t-value of 5.55.
- Whereas stock returns negatively predict the cross-section of stock returns at the one-month horizon, industries and factors both positively predict returns at this horizon.
- Similar to industry momentum, factor momentum is at its strongest with one-month formation and holding periods. However, as a test of robustness, the authors examined 36 strategies that use formation and holding periods ranging from one to six months. Each strategy’s Fama-French (2015) five-factor model alpha is statistically significant with a t-value of at least 3.25.
- Momentum in industry-adjusted factors fully subsumes industry momentum, while the reverse is not true. Factor momentum, again, is unique/independent.
- Controlling for individual stock momentum, industry momentum and the five Fama-French factors, all factor momentum strategies that use formation and holding periods ranging from one month to six months earn positive alphas. The strategy that stands out in both economic and statistical significance is the one that rotates factors based on their prior one-month returns and holds them for a month. This strategy’s alpha is 32 basis points per month with a t-value of 3.85.
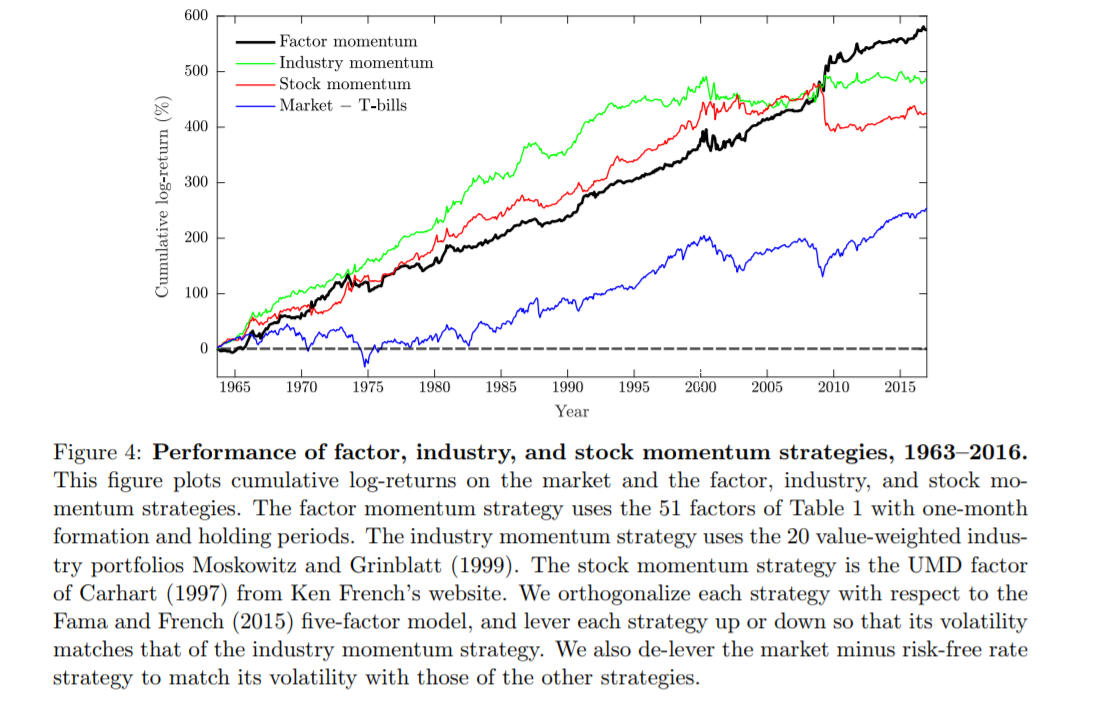
Here is the key chart from Arnott, Clements, Kalesnik and Linnainmaa’s paper that highlights the relative performance of factor, industry and stock momentum:
Summary
Given the risks of data mining, before investing in a factor, one should be confident there is sufficient evidence to support the belief that the premium found in the historical record is likely to be predictive of future results. To gain that confidence, you should have evidence that the premium was statistically significant and unique/independent, as well as that it showed persistence, pervasiveness, robustness, implementability and has risk-based or behavioral explanations for why it should be expected to continue.
Arnott, Clements, Kalesnik and Linnainmaa provide us with further evidence of the robustness and pervasiveness of cross-sectional momentum by demonstrating that it exists not only across stocks, industries, bonds, commodities and currencies, but across factors as well. They also show that it’s unique by demonstrating it is not subsumed by other factors, including industry momentum. Their findings also reveal new insights about the sources of momentum profits in well-diversified portfolios. Thus, their findings should provide investors greater confidence that increasing exposure to cross-sectional momentum is likely to improve portfolio efficiency.
References[+]
| ↑1 | More on the history of factors is available here. |
|---|---|
| ↑2 | For an in-depth discussion on each of these points, see my 2016 book “Your Complete Guide to Factor-Based Investing,” co-authored with Andrew Berkin. |
| ↑3 | For a detailed discussion of building momentum-based stock selection systems see “Quantitative Momentum” by Wes Gray and Jack Vogel. |
| ↑4 | An in-depth discussion of factors and transaction costs is available here. |
About the Author: Larry Swedroe
—
Important Disclosures
For informational and educational purposes only and should not be construed as specific investment, accounting, legal, or tax advice. Certain information is deemed to be reliable, but its accuracy and completeness cannot be guaranteed. Third party information may become outdated or otherwise superseded without notice. Neither the Securities and Exchange Commission (SEC) nor any other federal or state agency has approved, determined the accuracy, or confirmed the adequacy of this article.
The views and opinions expressed herein are those of the author and do not necessarily reflect the views of Alpha Architect, its affiliates or its employees. Our full disclosures are available here. Definitions of common statistics used in our analysis are available here (towards the bottom).
Join thousands of other readers and subscribe to our blog.