Large institutional investors have had access to low-cost “smart beta” for many years. But for retail investors and their financial advisors, “smart beta” ETFs are a welcome innovation. Instead of trying to identify an expensive manager who can pick stocks, a retail investor can leverage relatively low-cost smart beta active management and capture better risk-adjusted returns. These improved expected returns are delivered via exposures to different investment factors, including value, momentum, size, low volatility, and so forth. Makes sense, right? Indeed, mutual funds and ETFs featuring the “smart beta” label are now ubiquitous. However, as is true when choosing a cable provider, “let the buyer beware.”
For a quick refresher on some big-picture concepts to consider when reviewing smart beta products, here’s an overview we put together on the topic: How to Pick Smart Beta ETFs.
For those looking to dig a little deeper into this question, a recent white paper, authored by my friend,
Peter Hecht, PhD., is worth a look.
In the paper, Dr. Hecht describes the most common question he hears from prospective “smart beta” investors:
What should an investor expect regarding returns generated from smart beta strategies (e.g. value, momentum, carry, low volatility, etc.), and how does it compare to the historical backtested results that normally accompany smart beta strategies?
Indeed, just because a strategy has backtested well in the past, will it continue to work in the future?That, folks, is the $64,000 question. And Dr. Hecht immediately offers an answer.
Maybe, but there are a few things to consider. There are at least two good reasons why expected returns going forward could be lower than historical backtest results:
(1) Data Mining: “…backtests and theory are helpful for understanding the return properties of smart beta strategies, but they can’t completely mitigate the risks associated with unintended ‘data mining.'”
(2) Arbitrage: “…historical backtests may provide an inaccurate depiction of the future if the factor in question is now publicly known by the investment community with many products available to access it. In other words, some portion of the forward-looking return will likely be arbitraged away and, thus, not available to new investors.”
In order to assess the impact of these considerations, Dr. Hecht looks to the past for guidance.
Back in 1991, four famous factors–Size, Earnings-to-price, Debt-to-equity and Book-to-market–were discussed by Eugene Fama, whom Dr. Hecht describes as “the Michael Jordan of equity security selection research.” Fama’s original paper backtested these factors from 1936 to 1975.
So you can make a case that in 1991, when Fama published the paper, these factors were smart beta candidates at that time. Next, now that we have Fama’s in-sample backtest, representing smart beta candidates, we can ask what happens on an out-of-sample basis? To find out, Pete runs out-of-sample tests for these four synthetic “smart beta” exposures, examining the period from 1992 to 2015.
So do these factors hold up out-of-sample? Any reduction in returns would suggest that either data mining, arbitrage, or both, have had an impact.
What Does the Evidence Say?
Dr. Hecht finds that the out-of-sample returns are between 42% and 70% of the in-sample results. All four factors show decreased performance during the out-of-sample period. Interesting…
So what is going on during this 92-15 period? Is it possible that these strategies are truly robust, but simply had an unlucky streak of bad performance out of sample? Could the observed differences be driven purely by chance? Yes. The t-statistics are all less than 2, which is a traditional threshold for statistical significance. But the results still support the notion that data mining and arbitrage could play a significant role.
Dr. Hecht suggests that investors who look to backtests to inform their return expectations for the future may need to apply a “haircut.” That is, take the backtests with a grain of salt, and apply a discount. How big of a discount? Dr. Hecht suggests a 58% haircut to be conservative. Note that this corresponds to the low end of the 42%-70% range of out of sample returns discussed above.
Here are the tables from Pete’s paper:
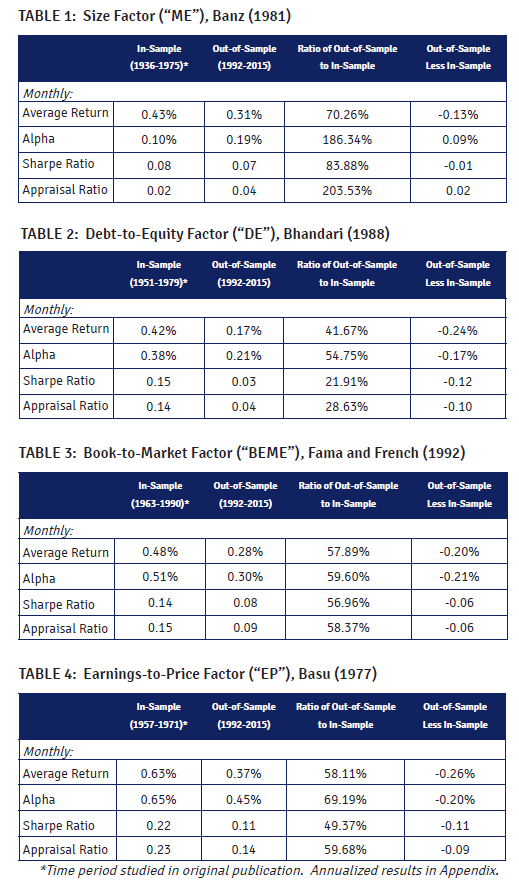
In-Sample and Out-of-Sample tests The results are hypothetical results and are NOT an indicator of future results and do NOT represent returns that any investor actually attained. Indexes are unmanaged, do not reflect management or trading fees, and one cannot invest directly in an index. Additional information regarding the construction of these results is available upon request.
Discussion:
- Smart anomalies OR data mining?
Backtests notoriously suffer from data mining. For instance, Harvey, Liu and Zhu (2015) backtested 300+ anomalies out-of-sample and found that most of them suffer from serious data-mining issues. Once adjusted for data-mining considerations, many anomalies won’t survive. Indeed, some fairly well-recognized anomalies don’t seem to stand up under closer scrutiny, including dividend yield, size, liquidity, volatility, etc. However, other anomalies do seem to withstand such scrutiny. Specifically, value and momentum investing show remarkable persistence out of sample. See here and here for our simulation studies on both anomalies.
- Can anomalies be arbitraged away by “smart money”?
Certainly. A new paper by McLean and Pontiff suggest that academic research can destroy stock return anomalies. In other words, once a strategy is disclosed. Directionally, I think the results are correct and they make economic sense — if a strategy can produce anomalous returns and it is easy to “arbitrage away,” competition will ensure the anomaly doesn’t last. However, there are many counter examples, where a seemingly anomalous result is published in academic research and the anomaly continues to work out of sample. Good example — trend following. This basis idea was documented at least since 1937. And it has worked well out of sample. Now that there is a new academic paper called “Time Series Momentum,” aka trend-following, will it magically disappear? Maybe. But the idea of following trends is not a new idea; it’s as old as the hills. Or how about cross-sectional momentum, better known as relative strength momentum? Levy published a paper on this in 1967. Jegadeesh and Titman essentially did the same paper in 1993.
So buying winners and selling losers is not a new idea. But why has momentum sustained since 1967? Or how about the value anomaly? Graham and Dodd wrote Security Analysis decades ago and value investing has been an open secret for at least 60 years. Buying cheap seems to be sustainable. But why do some anomalies get arbitraged away and why do some anomalies sustain? We’ve dedicated a massive blog post to the subject. Basically, sustainable anomalies need to be painful for short-horizon benchmark-focused investors. If they are easy to deploy with minimal career risk, an anomaly will be arbitraged away. If a strategy works, but comes with high career risk, it is less likely to be arbitraged away.
Takeaways:
Beware of backtests. Consider a haircut. Focus on alpha strategies that are sustainable, and sustainable alpha strategies require bouts of horrific relative performance. No pain, no gain.
About the Author: Wesley Gray, PhD
—
Important Disclosures
For informational and educational purposes only and should not be construed as specific investment, accounting, legal, or tax advice. Certain information is deemed to be reliable, but its accuracy and completeness cannot be guaranteed. Third party information may become outdated or otherwise superseded without notice. Neither the Securities and Exchange Commission (SEC) nor any other federal or state agency has approved, determined the accuracy, or confirmed the adequacy of this article.
The views and opinions expressed herein are those of the author and do not necessarily reflect the views of Alpha Architect, its affiliates or its employees. Our full disclosures are available here. Definitions of common statistics used in our analysis are available here (towards the bottom).
Join thousands of other readers and subscribe to our blog.